
Advertisement
- India
- /
- Food and Staples Retail
- /
- NSEI:SAKUMA
Has Sakuma Exports (NSE:SAKUMA) Got What It Takes To Become A Multi-Bagger?
If you're looking for a multi-bagger, there's a few things to keep an eye out for. One common approach is to try and find a company with returns on capital employed (ROCE) that are increasing, in conjunction with a growing amount of capital employed. This shows us that it's a compounding machine, able to continually reinvest its earnings back into the business and generate higher returns. However, after investigating Sakuma Exports (NSE:SAKUMA), we don't think it's current trends fit the mold of a multi-bagger.
Understanding Return On Capital Employed (ROCE)
For those that aren't sure what ROCE is, it measures the amount of pre-tax profits a company can generate from the capital employed in its business. The formula for this calculation on Sakuma Exports is:
Return on Capital Employed = Earnings Before Interest and Tax (EBIT) ÷ (Total Assets - Current Liabilities)
0.046 = ₹165m ÷ (₹11b - ₹7.7b) (Based on the trailing twelve months to March 2020).
So, Sakuma Exports has an ROCE of 4.6%. Even though it's in line with the industry average of 5.0%, it's still a low return by itself.
View our latest analysis for Sakuma Exports
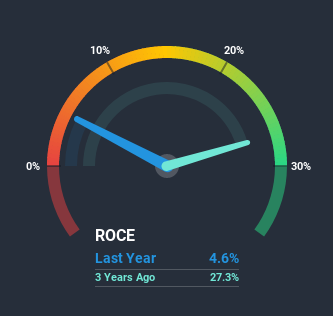
While the past is not representative of the future, it can be helpful to know how a company has performed historically, which is why we have this chart above. If you'd like to look at how Sakuma Exports has performed in the past in other metrics, you can view this free graph of past earnings, revenue and cash flow.
What Does the ROCE Trend For Sakuma Exports Tell Us?
The trend of ROCE doesn't look fantastic because it's fallen from 15% five years ago, while the business's capital employed increased by 262%. Usually this isn't ideal, but given Sakuma Exports conducted a capital raising before their most recent earnings announcement, that would've likely contributed, at least partially, to the increased capital employed figure. The funds raised likely haven't been put to work yet so it's worth watching what happens in the future with Sakuma Exports' earnings and if they change as a result from the capital raise.
On a related note, Sakuma Exports has decreased its current liabilities to 68% of total assets. So we could link some of this to the decrease in ROCE. Effectively this means their suppliers or short-term creditors are funding less of the business, which reduces some elements of risk. Since the business is basically funding more of its operations with it's own money, you could argue this has made the business less efficient at generating ROCE. Keep in mind 68% is still pretty high, so those risks are still somewhat prevalent.What We Can Learn From Sakuma Exports' ROCE
In summary, we're somewhat concerned by Sakuma Exports' diminishing returns on increasing amounts of capital. Yet despite these poor fundamentals, the stock has gained a huge 122% over the last five years, so investors appear very optimistic. In any case, the current underlying trends don't bode well for long term performance so unless they reverse, we'd start looking elsewhere.
If you want to continue researching Sakuma Exports, you might be interested to know about the 4 warning signs that our analysis has discovered.
If you want to search for solid companies with great earnings, check out this free list of companies with good balance sheets and impressive returns on equity.
If you decide to trade Sakuma Exports, use the lowest-cost* platform that is rated #1 Overall by Barron’s, Interactive Brokers. Trade stocks, options, futures, forex, bonds and funds on 135 markets, all from a single integrated account. Promoted
New: Manage All Your Stock Portfolios in One Place
We've created the ultimate portfolio companion for stock investors, and it's free.
• Connect an unlimited number of Portfolios and see your total in one currency
• Be alerted to new Warning Signs or Risks via email or mobile
• Track the Fair Value of your stocks
This article by Simply Wall St is general in nature. It does not constitute a recommendation to buy or sell any stock, and does not take account of your objectives, or your financial situation. We aim to bring you long-term focused analysis driven by fundamental data. Note that our analysis may not factor in the latest price-sensitive company announcements or qualitative material. Simply Wall St has no position in any stocks mentioned.
*Interactive Brokers Rated Lowest Cost Broker by StockBrokers.com Annual Online Review 2020
Have feedback on this article? Concerned about the content? Get in touch with us directly. Alternatively, email editorial-team@simplywallst.com.
About NSEI:SAKUMA
Mediocre balance sheet with questionable track record.
Similar Companies
Market Insights

Advertisement
Community Narratives
Quality at a Premium. A time to watch, not to buy?
Fair Value US$154.56|30.1% undervalued
DA
Community Contributor
GRAB: The Super-App at the Heart of Southeast Asia’s Digital Boom
Fair Value US$8.20|25.6% undervalued
BL
Community Contributor
Verve Group to Surge with 51.61% Revenue Growth
Fair Value €6.00|63.2% undervalued
ME
Community Contributor