Advertisement
- United States
- /
- Electronic Equipment and Components
- /
- NasdaqGS:FLEX
Evaluating Flex Ltd.’s (NASDAQ:FLEX) Investments In Its Business
Today we'll evaluate Flex Ltd. (NASDAQ:FLEX) to determine whether it could have potential as an investment idea. Specifically, we'll consider its Return On Capital Employed (ROCE), since that will give us an insight into how efficiently the business can generate profits from the capital it requires.
First, we'll go over how we calculate ROCE. Next, we'll compare it to others in its industry. And finally, we'll look at how its current liabilities are impacting its ROCE.
What is Return On Capital Employed (ROCE)?
ROCE measures the 'return' (pre-tax profit) a company generates from capital employed in its business. In general, businesses with a higher ROCE are usually better quality. In brief, it is a useful tool, but it is not without drawbacks. Author Edwin Whiting says to be careful when comparing the ROCE of different businesses, since 'No two businesses are exactly alike.'
So, How Do We Calculate ROCE?
The formula for calculating the return on capital employed is:
Return on Capital Employed = Earnings Before Interest and Tax (EBIT) ÷ (Total Assets - Current Liabilities)
Or for Flex:
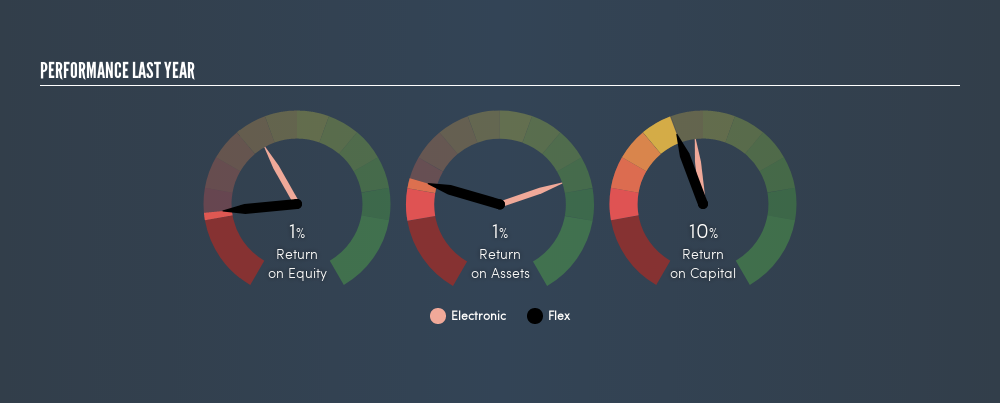
0.095 = US$666m ÷ (US$14b - US$7.4b) (Based on the trailing twelve months to June 2019.)
Therefore, Flex has an ROCE of 9.5%.
View our latest analysis for Flex
Does Flex Have A Good ROCE?
ROCE is commonly used for comparing the performance of similar businesses. It appears that Flex's ROCE is fairly close to the Electronic industry average of 12%. Setting aside the industry comparison for now, Flex's ROCE is mediocre in absolute terms, considering the risk of investing in stocks versus the safety of a bank account. Readers may find more attractive investment prospects elsewhere.
Remember that this metric is backwards looking - it shows what has happened in the past, and does not accurately predict the future. Companies in cyclical industries can be difficult to understand using ROCE, as returns typically look high during boom times, and low during busts. ROCE is, after all, simply a snap shot of a single year. Future performance is what matters, and you can see analyst predictions in our free report on analyst forecasts for the company.
What Are Current Liabilities, And How Do They Affect Flex's ROCE?
Current liabilities include invoices, such as supplier payments, short-term debt, or a tax bill, that need to be paid within 12 months. The ROCE equation subtracts current liabilities from capital employed, so a company with a lot of current liabilities appears to have less capital employed, and a higher ROCE than otherwise. To counter this, investors can check if a company has high current liabilities relative to total assets.
Flex has total liabilities of US$7.4b and total assets of US$14b. As a result, its current liabilities are equal to approximately 52% of its total assets. Flex's current liabilities are fairly high, making its ROCE look better than otherwise.
Our Take On Flex's ROCE
Despite this, the company also has a uninspiring ROCE, which is not an ideal combination in this analysis. Of course, you might find a fantastic investment by looking at a few good candidates. So take a peek at this free list of companies with modest (or no) debt, trading on a P/E below 20.
For those who like to find winning investments this free list of growing companies with recent insider purchasing, could be just the ticket.
We aim to bring you long-term focused research analysis driven by fundamental data. Note that our analysis may not factor in the latest price-sensitive company announcements or qualitative material.
If you spot an error that warrants correction, please contact the editor at editorial-team@simplywallst.com. This article by Simply Wall St is general in nature. It does not constitute a recommendation to buy or sell any stock, and does not take account of your objectives, or your financial situation. Simply Wall St has no position in the stocks mentioned. Thank you for reading.
About NasdaqGS:FLEX
Flex
Provides technology innovation, supply chain, and manufacturing solutions to data center, communications, enterprise, consumer, automotive, healthcare, industrial, and power industries in the Americas, Asia, and Europe.
Flawless balance sheet with high growth potential.
Similar Companies
Market Insights


Advertisement
Weekly Picks
DA


davidlsander on Nevgold ·
The U.S. Government Is Desperate for This Metal. This Tiny Miner Has It -- Its Closest Peer Is Already Worth Double.
Fair Value:US$2.1939.7% undervalued
17 followersusers have followed this narrative
0 commentsusers have commented on this narrative
2 likesusers have liked this narrative
BE

benjamin_lvieq on PayPal Holdings ·
PayPal: PayPal Doesn't Need to Grow – It Needs to Stop Falling – A Mispriced Cash Machine With a Cannibal Buyback
Fair Value:US$6527.1% undervalued
42 followersusers have followed this narrative
1 commentusers have commented on this narrative
6 likesusers have liked this narrative
JD

JD009 on Celsius Holdings ·
From $5M to $2B: Why the 2024 Crash Was the Best Buying Opportunity in Consumer Stocks
Fair Value:US$55.4345.6% undervalued
14 followersusers have followed this narrative
1 commentusers have commented on this narrative
7 likesusers have liked this narrative
WA

Wavefarer on Accenture ·
High-quality global services company facing an AI-driven valuation reset.
Fair Value:US$30155.3% undervalued
9 followersusers have followed this narrative
0 commentsusers have commented on this narrative
2 likesusers have liked this narrative
Recently Updated Narratives
OL

olexander_ua on Crocs ·
Crocs will step into the future with revenue growth
Fair Value:US$291.27k100.0% undervalued
1 followerusers have followed this narrative
0 commentsusers have commented on this narrative
0 likesusers have liked this narrative
ES

Esteban on Tyler Technologies ·
Tyler Technologies 04-2026
Fair Value:US$144.97107.8% overvalued
3 followersusers have followed this narrative
0 commentsusers have commented on this narrative
0 likesusers have liked this narrative
PI


PittTheYounger on Erste Group Bank ·
An Austrian industry leader with attractive CEE exposure
Fair Value:€149.2323.0% undervalued
1 followerusers have followed this narrative
0 commentsusers have commented on this narrative
0 likesusers have liked this narrative
Popular Narratives
IN


Investingwilly on Mastercard ·
Mastercard: The Best Dividend Stock You're Ignoring
Fair Value:US$75028.3% undervalued
90 followersusers have followed this narrative
1 commentusers have commented on this narrative
9 likesusers have liked this narrative
BL


BlackGoat on Cerebras Systems ·
The Wafer Giant Threatening NVIDIA's GPU Hegemony
Fair Value:US$415.5451.0% undervalued
63 followersusers have followed this narrative
3 commentsusers have commented on this narrative
11 likesusers have liked this narrative
CE


Ceazar on Conexeu Sciences ·
This small biotech is developing technology that could potentially change how tissue is rebuilt
Fair Value:US$25.3462.5% undervalued
60 followersusers have followed this narrative
0 commentsusers have commented on this narrative
9 likesusers have liked this narrative

