Advertisement
Estimating The Intrinsic Value Of JD.com, Inc. (NASDAQ:JD)
How far off is JD.com, Inc. (NASDAQ:JD) from its intrinsic value? Using the most recent financial data, we'll take a look at whether the stock is fairly priced by estimating the company's future cash flows and discounting them to their present value. I will be using the Discounted Cash Flow (DCF) model. Don't get put off by the jargon, the math behind it is actually quite straightforward.
Remember though, that there are many ways to estimate a company's value, and a DCF is just one method. Anyone interested in learning a bit more about intrinsic value should have a read of the Simply Wall St analysis model.
Check out our latest analysis for JD.com
Is JD.com fairly valued?
We're using the 2-stage growth model, which simply means we take in account two stages of company's growth. In the initial period the company may have a higher growth rate and the second stage is usually assumed to have a stable growth rate. In the first stage we need to estimate the cash flows to the business over the next ten years. Where possible we use analyst estimates, but when these aren't available we extrapolate the previous free cash flow (FCF) from the last estimate or reported value. We assume companies with shrinking free cash flow will slow their rate of shrinkage, and that companies with growing free cash flow will see their growth rate slow, over this period. We do this to reflect that growth tends to slow more in the early years than it does in later years.
Generally we assume that a dollar today is more valuable than a dollar in the future, and so the sum of these future cash flows is then discounted to today's value:
10-year free cash flow (FCF) estimate
| 2020 | 2021 | 2022 | 2023 | 2024 | 2025 | 2026 | 2027 | 2028 | 2029 | |
| Levered FCF (CN¥, Millions) | CN¥16.0b | CN¥30.9b | CN¥27.9b | CN¥30.5b | CN¥32.6b | CN¥34.3b | CN¥35.9b | CN¥37.4b | CN¥38.8b | CN¥40.1b |
| Growth Rate Estimate Source | Analyst x9 | Analyst x8 | Analyst x1 | Analyst x1 | Est @ 6.64% | Est @ 5.47% | Est @ 4.65% | Est @ 4.07% | Est @ 3.67% | Est @ 3.39% |
| Present Value (CN¥, Millions) Discounted @ 12% | CN¥14.3k | CN¥24.8k | CN¥20.1k | CN¥19.7k | CN¥18.8k | CN¥17.8k | CN¥16.7k | CN¥15.5k | CN¥14.4k | CN¥13.4k |
("Est" = FCF growth rate estimated by Simply Wall St)
Present Value of 10-year Cash Flow (PVCF) = CN¥176b
The second stage is also known as Terminal Value, this is the business's cash flow after the first stage. The Gordon Growth formula is used to calculate Terminal Value at a future annual growth rate equal to the 10-year government bond rate of 2.7%. We discount the terminal cash flows to today's value at a cost of equity of 12%.
Terminal Value (TV)= FCF2029 × (1 + g) ÷ (r – g) = CN¥40b× (1 + 2.7%) ÷ 12%– 2.7%) = CN¥464b
Present Value of Terminal Value (PVTV)= TV / (1 + r)10= CN¥464b÷ ( 1 + 12%)10= CN¥155b
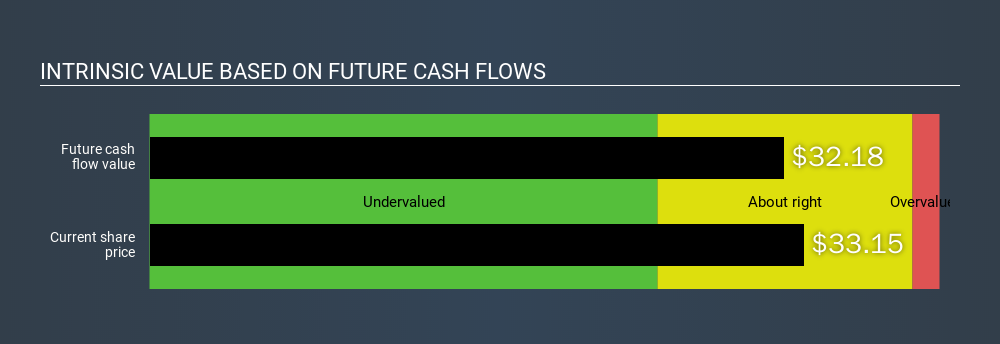
The total value, or equity value, is then the sum of the present value of the future cash flows, which in this case is CN¥330b. In the final step we divide the equity value by the number of shares outstanding. Compared to the current share price of US$33.2, the company appears around fair value at the time of writing. The assumptions in any calculation have a big impact on the valuation, so it is better to view this as a rough estimate, not precise down to the last cent.
The assumptions
The calculation above is very dependent on two assumptions. The first is the discount rate and the other is the cash flows. You don't have to agree with these inputs, I recommend redoing the calculations yourself and playing with them. The DCF also does not consider the possible cyclicality of an industry, or a company's future capital requirements, so it does not give a full picture of a company's potential performance. Given that we are looking at JD.com as potential shareholders, the cost of equity is used as the discount rate, rather than the cost of capital (or weighted average cost of capital, WACC) which accounts for debt. In this calculation we've used 12%, which is based on a levered beta of 1.489. Beta is a measure of a stock's volatility, compared to the market as a whole. We get our beta from the industry average beta of globally comparable companies, with an imposed limit between 0.8 and 2.0, which is a reasonable range for a stable business.
Next Steps:
Whilst important, DCF calculation shouldn’t be the only metric you look at when researching a company. The DCF model is not a perfect stock valuation tool. Rather it should be seen as a guide to "what assumptions need to be true for this stock to be under/overvalued?" If a company grows at a different rate, or if its cost of equity or risk free rate changes sharply, the output can look very different. For JD.com, There are three important factors you should further examine:
- Financial Health: Does JD have a healthy balance sheet? Take a look at our free balance sheet analysis with six simple checks on key factors like leverage and risk.
- Future Earnings: How does JD's growth rate compare to its peers and the wider market? Dig deeper into the analyst consensus number for the upcoming years by interacting with our free analyst growth expectation chart.
- Other High Quality Alternatives: Are there other high quality stocks you could be holding instead of JD? Explore our interactive list of high quality stocks to get an idea of what else is out there you may be missing!
PS. Simply Wall St updates its DCF calculation for every US stock every day, so if you want to find the intrinsic value of any other stock just search here.
If you spot an error that warrants correction, please contact the editor at editorial-team@simplywallst.com. This article by Simply Wall St is general in nature. It does not constitute a recommendation to buy or sell any stock, and does not take account of your objectives, or your financial situation. Simply Wall St has no position in the stocks mentioned.
We aim to bring you long-term focused research analysis driven by fundamental data. Note that our analysis may not factor in the latest price-sensitive company announcements or qualitative material. Thank you for reading.
About NasdaqGS:JD
JD.com
Operates as a supply chain-based technology and service provider in the People’s Republic of China and Europe.
Undervalued with adequate balance sheet.
Similar Companies
Market Insights


Advertisement
Weekly Picks
ST


stuart_roberts on Upside Gold ·
An Undervalued 3.3Moz Gold Project in Canada
Fair Value:CA$5.0777.3% undervalued
169 followersusers have followed this narrative
1 commentusers have commented on this narrative
26 likesusers have liked this narrative
CL


Clive_Thompson on Hermès International Société en commandite par actions ·
Hermès - Expensive bags, and expensive stock. And the story of €14 billion of bearer shares gone missing.
Fair Value:€1.51k10.0% overvalued
21 followersusers have followed this narrative
1 commentusers have commented on this narrative
23 likesusers have liked this narrative
SU

superbullll on Cheniere Energy ·
Cheniere Energy (LNG) — The Toll Road That Geopolitics Just Made More Valuable
Fair Value:US$320.9412.5% undervalued
22 followersusers have followed this narrative
0 commentsusers have commented on this narrative
6 likesusers have liked this narrative
SA

Salman2415 on GNG Electronics ·
Strong execution in a growing category, but long‑term value hinges on cash‑flow discipline
Fair Value:₹135.87179.9% overvalued
10 followersusers have followed this narrative
1 commentusers have commented on this narrative
2 likesusers have liked this narrative
Recently Updated Narratives
CO


composite32 on TotalEnergies ·
Is This strategic transformation of TTE? Significant re-rating potential
Fair Value:€88.2912.8% undervalued
9 followersusers have followed this narrative
2 commentsusers have commented on this narrative
0 likesusers have liked this narrative
AG


Agricola on Silver X Mining ·
A Case for Silver X reaching CAD$18 by 2031 (a possible 30 bagger)
Fair Value:CA$1896.4% undervalued
1 followerusers have followed this narrative
1 commentusers have commented on this narrative
0 likesusers have liked this narrative
VE


Vestra on Korea Electric Power ·
Korea Electric Power Corp (KEP): The Grid’s Tug-of-War – AI Demand vs. The Strait of Hormuz
Fair Value:US$32.5150.8% undervalued
2 followersusers have followed this narrative
0 commentsusers have commented on this narrative
0 likesusers have liked this narrative
Popular Narratives
KA

kabz2342 on Nu Holdings ·
Nu holdings will continue to disrupt the South American banking market
Fair Value:US$64.378.3% undervalued
55 followersusers have followed this narrative
3 commentsusers have commented on this narrative
29 likesusers have liked this narrative
YA

Yang_ on SoFi Technologies ·
SoFi Technologies: The Apex Aggregator and the Infrastructure of the Modern Financial System
Fair Value:US$22.9826.5% undervalued
47 followersusers have followed this narrative
0 commentsusers have commented on this narrative
35 likesusers have liked this narrative
PD

pdixit1 on Vertiv Holdings Co ·
The Infrastructure AI Cannot Be Built Without
Fair Value:US$408.6437.4% undervalued
39 followersusers have followed this narrative
3 commentsusers have commented on this narrative
18 likesusers have liked this narrative
Trending Discussion
OD

Oddlott on lululemon athletica ·
Thankyou for the interesting comments. So what is the world wide including USA growth rate?
0
|0
