
Advertisement
Estimating The Fair Value Of Qantas Airways Limited (ASX:QAN)

In this article we are going to estimate the intrinsic value of Qantas Airways Limited (ASX:QAN) by estimating the company's future cash flows and discounting them to their present value. Our analysis will employ the Discounted Cash Flow (DCF) model. Believe it or not, it's not too difficult to follow, as you'll see from our example!
Companies can be valued in a lot of ways, so we would point out that a DCF is not perfect for every situation. For those who are keen learners of equity analysis, the Simply Wall St analysis model here may be something of interest to you.
See our latest analysis for Qantas Airways
Is Qantas Airways fairly valued?
We are going to use a two-stage DCF model, which, as the name states, takes into account two stages of growth. The first stage is generally a higher growth period which levels off heading towards the terminal value, captured in the second 'steady growth' period. To begin with, we have to get estimates of the next ten years of cash flows. Where possible we use analyst estimates, but when these aren't available we extrapolate the previous free cash flow (FCF) from the last estimate or reported value. We assume companies with shrinking free cash flow will slow their rate of shrinkage, and that companies with growing free cash flow will see their growth rate slow, over this period. We do this to reflect that growth tends to slow more in the early years than it does in later years.
Generally we assume that a dollar today is more valuable than a dollar in the future, and so the sum of these future cash flows is then discounted to today's value:
10-year free cash flow (FCF) estimate
| 2021 | 2022 | 2023 | 2024 | 2025 | 2026 | 2027 | 2028 | 2029 | 2030 | |
| Levered FCF (A$, Millions) | -AU$2.2b | AU$1.93b | AU$1.88b | AU$1.52b | AU$1.10b | AU$966.9m | AU$893.5m | AU$852.0m | AU$830.2m | AU$820.9m |
| Growth Rate Estimate Source | Analyst x4 | Analyst x3 | Analyst x3 | Analyst x2 | Analyst x2 | Est @ -11.82% | Est @ -7.59% | Est @ -4.64% | Est @ -2.57% | Est @ -1.12% |
| Present Value (A$, Millions) Discounted @ 9.6% | -AU$2.1k | AU$1.6k | AU$1.4k | AU$1.1k | AU$694 | AU$558 | AU$471 | AU$410 | AU$364 | AU$329 |
("Est" = FCF growth rate estimated by Simply Wall St)
Present Value of 10-year Cash Flow (PVCF) = AU$4.9b
We now need to calculate the Terminal Value, which accounts for all the future cash flows after this ten year period. The Gordon Growth formula is used to calculate Terminal Value at a future annual growth rate equal to the 5-year average of the 10-year government bond yield of 2.3%. We discount the terminal cash flows to today's value at a cost of equity of 9.6%.
Terminal Value (TV)= FCF2030 × (1 + g) ÷ (r – g) = AU$821m× (1 + 2.3%) ÷ (9.6%– 2.3%) = AU$11b
Present Value of Terminal Value (PVTV)= TV / (1 + r)10= AU$11b÷ ( 1 + 9.6%)10= AU$4.6b
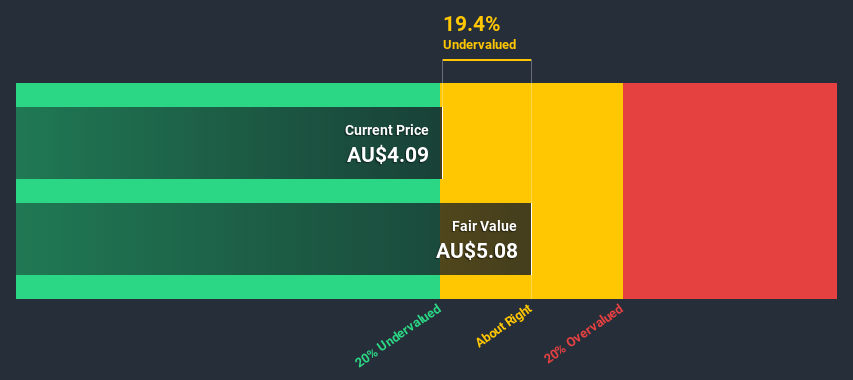
The total value is the sum of cash flows for the next ten years plus the discounted terminal value, which results in the Total Equity Value, which in this case is AU$9.5b. The last step is to then divide the equity value by the number of shares outstanding. Relative to the current share price of AU$4.1, the company appears about fair value at a 19% discount to where the stock price trades currently. The assumptions in any calculation have a big impact on the valuation, so it is better to view this as a rough estimate, not precise down to the last cent.
The assumptions
Now the most important inputs to a discounted cash flow are the discount rate, and of course, the actual cash flows. You don't have to agree with these inputs, I recommend redoing the calculations yourself and playing with them. The DCF also does not consider the possible cyclicality of an industry, or a company's future capital requirements, so it does not give a full picture of a company's potential performance. Given that we are looking at Qantas Airways as potential shareholders, the cost of equity is used as the discount rate, rather than the cost of capital (or weighted average cost of capital, WACC) which accounts for debt. In this calculation we've used 9.6%, which is based on a levered beta of 1.218. Beta is a measure of a stock's volatility, compared to the market as a whole. We get our beta from the industry average beta of globally comparable companies, with an imposed limit between 0.8 and 2.0, which is a reasonable range for a stable business.
Next Steps:
Whilst important, the DCF calculation is only one of many factors that you need to assess for a company. DCF models are not the be-all and end-all of investment valuation. Rather it should be seen as a guide to "what assumptions need to be true for this stock to be under/overvalued?" For example, changes in the company's cost of equity or the risk free rate can significantly impact the valuation. For Qantas Airways, we've compiled three additional items you should consider:
- Risks: To that end, you should learn about the 2 warning signs we've spotted with Qantas Airways (including 1 which is a bit unpleasant) .
- Future Earnings: How does QAN's growth rate compare to its peers and the wider market? Dig deeper into the analyst consensus number for the upcoming years by interacting with our free analyst growth expectation chart.
- Other Solid Businesses: Low debt, high returns on equity and good past performance are fundamental to a strong business. Why not explore our interactive list of stocks with solid business fundamentals to see if there are other companies you may not have considered!
PS. The Simply Wall St app conducts a discounted cash flow valuation for every stock on the ASX every day. If you want to find the calculation for other stocks just search here.
When trading Qantas Airways or any other investment, use the platform considered by many to be the Professional's Gateway to the Worlds Market, Interactive Brokers. You get the lowest-cost* trading on stocks, options, futures, forex, bonds and funds worldwide from a single integrated account. Promoted
Valuation is complex, but we're here to simplify it.
Discover if Qantas Airways might be undervalued or overvalued with our detailed analysis, featuring fair value estimates, potential risks, dividends, insider trades, and its financial condition.
Access Free AnalysisThis article by Simply Wall St is general in nature. It does not constitute a recommendation to buy or sell any stock, and does not take account of your objectives, or your financial situation. We aim to bring you long-term focused analysis driven by fundamental data. Note that our analysis may not factor in the latest price-sensitive company announcements or qualitative material. Simply Wall St has no position in any stocks mentioned.
*Interactive Brokers Rated Lowest Cost Broker by StockBrokers.com Annual Online Review 2020
Have feedback on this article? Concerned about the content? Get in touch with us directly. Alternatively, email editorial-team@simplywallst.com.
About ASX:QAN
Qantas Airways
Provides air transportation services in Australia and internationally.
Moderate growth potential second-rate dividend payer.
Similar Companies
Market Insights


Advertisement
Community Narratives
For the Emperor: Why Games Workshop Could Be a Star Investment
Fair Value UK£160.00|0.4% overvalued
RO
Community Contributor
Securitas will boost margins with AI and tech-driven services
Fair Value SEK 260.91|44.5% undervalued
UN
Community Contributor
A Leader in EV Charging with Growth Potential
Fair Value €27.00|17.8% undervalued
TI
Community Contributor