Advertisement
- United Kingdom
- /
- Trade Distributors
- /
- LSE:RS1
Estimating The Fair Value Of Electrocomponents plc (LON:ECM)
Does the September share price for Electrocomponents plc (LON:ECM) reflect what it's really worth? Today, we will estimate the stock's intrinsic value by projecting its future cash flows and then discounting them to today's value. This is done using the Discounted Cash Flow (DCF) model. Don't get put off by the jargon, the math behind it is actually quite straightforward.
We generally believe that a company's value is the present value of all of the cash it will generate in the future. However, a DCF is just one valuation metric among many, and it is not without flaws. If you want to learn more about discounted cash flow, the rationale behind this calculation can be read in detail in the Simply Wall St analysis model.
See our latest analysis for Electrocomponents
The calculation
We're using the 2-stage growth model, which simply means we take in account two stages of company's growth. In the initial period the company may have a higher growth rate and the second stage is usually assumed to have a stable growth rate. In the first stage we need to estimate the cash flows to the business over the next ten years. Where possible we use analyst estimates, but when these aren't available we extrapolate the previous free cash flow (FCF) from the last estimate or reported value. We assume companies with shrinking free cash flow will slow their rate of shrinkage, and that companies with growing free cash flow will see their growth rate slow, over this period. We do this to reflect that growth tends to slow more in the early years than it does in later years.
A DCF is all about the idea that a dollar in the future is less valuable than a dollar today, and so the sum of these future cash flows is then discounted to today's value:
10-year free cash flow (FCF) estimate
| 2020 | 2021 | 2022 | 2023 | 2024 | 2025 | 2026 | 2027 | 2028 | 2029 | |
| Levered FCF (£, Millions) | £80.4m | £130.6m | £178.6m | £211.2m | £239.0m | £261.8m | £280.3m | £295.3m | £307.3m | £317.3m |
| Growth Rate Estimate Source | Analyst x6 | Analyst x6 | Analyst x6 | Est @ 18.26% | Est @ 13.15% | Est @ 9.57% | Est @ 7.07% | Est @ 5.32% | Est @ 4.09% | Est @ 3.23% |
| Present Value (£, Millions) Discounted @ 8.8% | £73.9 | £110.3 | £138.6 | £150.7 | £156.7 | £157.8 | £155.3 | £150.3 | £143.8 | £136.4 |
("Est" = FCF growth rate estimated by Simply Wall St)
Present Value of 10-year Cash Flow (PVCF)= £1.4b
After calculating the present value of future cash flows in the intial 10-year period, we need to calculate the Terminal Value, which accounts for all future cash flows beyond the first stage. For a number of reasons a very conservative growth rate is used that cannot exceed that of a country's GDP growth. In this case we have used the 10-year government bond rate (1.2%) to estimate future growth. In the same way as with the 10-year 'growth' period, we discount future cash flows to today's value, using a cost of equity of 8.8%.
Terminal Value (TV) = FCF2029 × (1 + g) ÷ (r – g) = UK£317m × (1 + 1.2%) ÷ (8.8% – 1.2%) = UK£4.2b
Present Value of Terminal Value (PVTV) = TV / (1 + r)10 = £UK£4.2b ÷ ( 1 + 8.8%)10 = £1.82b
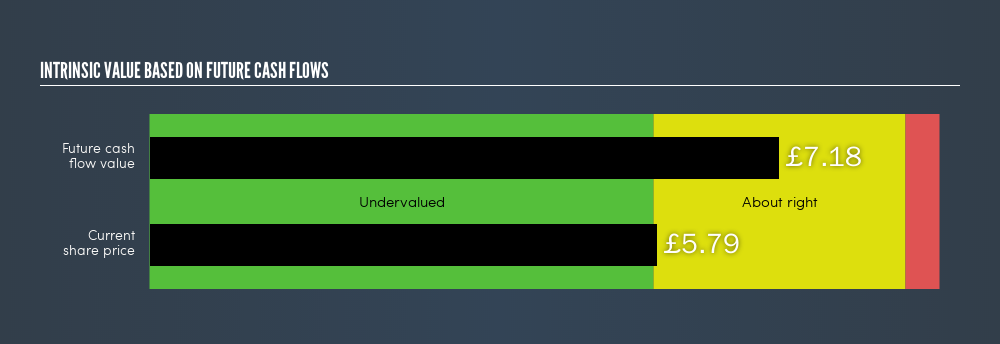
The total value is the sum of cash flows for the next ten years plus the discounted terminal value, which results in the Total Equity Value, which in this case is £3.20b. To get the intrinsic value per share, we divide this by the total number of shares outstanding. This results in an intrinsic value estimate of £7.18. Relative to the current share price of £5.79, the company appears about fair value at a 19% discount to where the stock price trades currently. The assumptions in any calculation have a big impact on the valuation, so it is better to view this as a rough estimate, not precise down to the last cent.
The assumptions
We would point out that the most important inputs to a discounted cash flow are the discount rate and of course the actual cash flows. Part of investing is coming up with your own evaluation of a company's future performance, so try the calculation yourself and check your own assumptions. The DCF also does not consider the possible cyclicality of an industry, or a company's future capital requirements, so it does not give a full picture of a company's potential performance. Given that we are looking at Electrocomponents as potential shareholders, the cost of equity is used as the discount rate, rather than the cost of capital (or weighted average cost of capital, WACC) which accounts for debt. In this calculation we've used 8.8%, which is based on a levered beta of 1.14. Beta is a measure of a stock's volatility, compared to the market as a whole. We get our beta from the industry average beta of globally comparable companies, with an imposed limit between 0.8 and 2.0, which is a reasonable range for a stable business.
Next Steps:
Although the valuation of a company is important, it shouldn’t be the only metric you look at when researching a company. The DCF model is not a perfect stock valuation tool. Rather it should be seen as a guide to "what assumptions need to be true for this stock to be under/overvalued?" If a company grows at a different rate, or if its cost of equity or risk free rate changes sharply, the output can look very different. For Electrocomponents, I've put together three essential factors you should look at:
- Financial Health: Does ECM have a healthy balance sheet? Take a look at our free balance sheet analysis with six simple checks on key factors like leverage and risk.
- Future Earnings: How does ECM's growth rate compare to its peers and the wider market? Dig deeper into the analyst consensus number for the upcoming years by interacting with our free analyst growth expectation chart.
- Other High Quality Alternatives: Are there other high quality stocks you could be holding instead of ECM? Explore our interactive list of high quality stocks to get an idea of what else is out there you may be missing!
PS. The Simply Wall St app conducts a discounted cash flow valuation for every stock on the LON every day. If you want to find the calculation for other stocks just search here.
We aim to bring you long-term focused research analysis driven by fundamental data. Note that our analysis may not factor in the latest price-sensitive company announcements or qualitative material.
If you spot an error that warrants correction, please contact the editor at editorial-team@simplywallst.com. This article by Simply Wall St is general in nature. It does not constitute a recommendation to buy or sell any stock, and does not take account of your objectives, or your financial situation. Simply Wall St has no position in the stocks mentioned. Thank you for reading.
About LSE:RS1
RS Group
Engages in the distribution of maintenance, repair, and operations products and service solutions in the United Kingdom, the United States, France, Mexico, Germany, Italy, Switzerland, and internationally.
Excellent balance sheet established dividend payer.
Similar Companies
Market Insights


Advertisement
Weekly Picks
CE


Ceazar on Sparc AI ·
When GPS fails: this small cap is fixing a $54B drone problem
Fair Value:CA$5.2552.0% undervalued
121 followersusers have followed this narrative
0 commentsusers have commented on this narrative
25 likesusers have liked this narrative
BL


BlackGoat on IREN ·
IREN's Bold Moves in Sustainable Bitcoin Mining & AI Data Centers
Fair Value:US$71.4848.5% undervalued
222 followersusers have followed this narrative
9 commentsusers have commented on this narrative
33 likesusers have liked this narrative
HE


HedgeY on Arm Holdings ·
The Architecture Layer of AI Computing - But Priced Like the Future Already Arrived?
Fair Value:US$43044.3% undervalued
24 followersusers have followed this narrative
1 commentusers have commented on this narrative
7 likesusers have liked this narrative
HI


Hidden_Rock_Capital on Fiserv ·
Temporary "perfect storm" leads to opportunity to buy financial services leader for less than 5x long-term earnings
Fair Value:US$119.9955.0% undervalued
32 followersusers have followed this narrative
1 commentusers have commented on this narrative
10 likesusers have liked this narrative
Recently Updated Narratives
AL

alexandru_g3 on Alibaba Group Holding ·
One of the Most Mispriced Technology Ecosystems in the Market
Fair Value:US$241.9149.5% undervalued
1 followerusers have followed this narrative
0 commentsusers have commented on this narrative
0 likesusers have liked this narrative
AN


andre_santos on Microsoft ·
Microsoft - A Fundamental Valuation
Fair Value:US$507.348.4% undervalued
27 followersusers have followed this narrative
4 commentsusers have commented on this narrative
0 likesusers have liked this narrative
AH

AHaron on Eli Lilly ·
Eli Lilly: A Pipeline-Driven Growth Story Trading 30% Below What the Business Is Actually Worth
Fair Value:US$1.48k22.2% undervalued
42 followersusers have followed this narrative
0 commentsusers have commented on this narrative
0 likesusers have liked this narrative
Popular Narratives
OS


oscargarcia on NVIDIA ·
The company that went from selling GPUs to gamers to becoming the AI arms dealer of the 21st century.
Fair Value:US$28028.3% undervalued
223 followersusers have followed this narrative
9 commentsusers have commented on this narrative
15 likesusers have liked this narrative
CU
CubanEros on Microsoft ·
A wonderful business at reasonable price.
Fair Value:US$419.9110.7% overvalued
101 followersusers have followed this narrative
0 commentsusers have commented on this narrative
7 likesusers have liked this narrative
TR


tripledub on Alphabet ·
Warren Buffett Just Bet $10 Billion on Google. The Catch? You May Already Be Too Late.
Fair Value:US$23054.8% overvalued
118 followersusers have followed this narrative
1 commentusers have commented on this narrative
18 likesusers have liked this narrative
Trending Discussion
GR
greg_xasak on Fiserv ·
As someone who has dealt directly with them as a CTO for a credit union, I have 8 years of horror stories about doing business with them. If there was any other competitor than could deliver 80% of Fiserv services, there would be a mad rush to migrate to them. They should thank their lucky stars they are a near monopoly. this industry is so ripe for a well funded competitor. Their integration of technology is awful, their ability to fix their own implementation screwups is sadly tragic. Sometimes they just silently kill support tickets without resolution and you never find out until you do a follow up inquiry. Why, because sometimes no one you are dealing with knows how to fix it and knows no one to ask for help. They can not meet their own implementation deadlines and sometimes there is no one on a technical team dealing with you that has any banking or credit union experience. The is an industry insider phrase when you meet other Fiserv customers called being "Fiserved". It means telling others of your worst stories of dealing with them. Ask around, all CTO's have some doozies.
1
|0

