Advertisement
- United States
- /
- IT
- /
- NasdaqGS:HCKT
Does The Hackett Group, Inc. (NASDAQ:HCKT) Have A Good P/E Ratio?
This article is for investors who would like to improve their understanding of price to earnings ratios (P/E ratios). To keep it practical, we'll show how The Hackett Group, Inc.'s (NASDAQ:HCKT) P/E ratio could help you assess the value on offer. Looking at earnings over the last twelve months, Hackett Group has a P/E ratio of 21.89. In other words, at today's prices, investors are paying $21.89 for every $1 in prior year profit.
Check out our latest analysis for Hackett Group
How Do You Calculate A P/E Ratio?
The formula for P/E is:
Price to Earnings Ratio = Price per Share ÷ Earnings per Share (EPS)
Or for Hackett Group:
P/E of 21.89 = USD17.10 ÷ USD0.78 (Based on the year to December 2019.)
Is A High Price-to-Earnings Ratio Good?
A higher P/E ratio implies that investors pay a higher price for the earning power of the business. That is not a good or a bad thing per se, but a high P/E does imply buyers are optimistic about the future.
Does Hackett Group Have A Relatively High Or Low P/E For Its Industry?
One good way to get a quick read on what market participants expect of a company is to look at its P/E ratio. If you look at the image below, you can see Hackett Group has a lower P/E than the average (31.4) in the it industry classification.
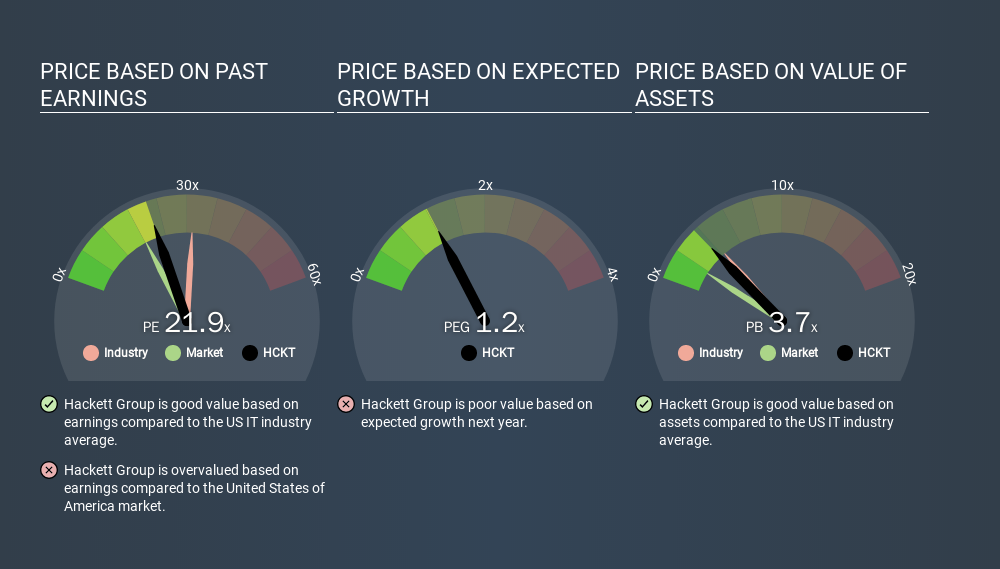
Its relatively low P/E ratio indicates that Hackett Group shareholders think it will struggle to do as well as other companies in its industry classification. While current expectations are low, the stock could be undervalued if the situation is better than the market assumes. You should delve deeper. I like to check if company insiders have been buying or selling.
How Growth Rates Impact P/E Ratios
Earnings growth rates have a big influence on P/E ratios. Earnings growth means that in the future the 'E' will be higher. Therefore, even if you pay a high multiple of earnings now, that multiple will become lower in the future. And as that P/E ratio drops, the company will look cheap, unless its share price increases.
Hackett Group saw earnings per share decrease by 16% last year. But EPS is up 18% over the last 5 years.
Don't Forget: The P/E Does Not Account For Debt or Bank Deposits
The 'Price' in P/E reflects the market capitalization of the company. That means it doesn't take debt or cash into account. In theory, a company can lower its future P/E ratio by using cash or debt to invest in growth.
Such expenditure might be good or bad, in the long term, but the point here is that the balance sheet is not reflected by this ratio.
Hackett Group's Balance Sheet
Hackett Group has net cash of US$26m. That should lead to a higher P/E than if it did have debt, because its strong balance sheets gives it more options.
The Bottom Line On Hackett Group's P/E Ratio
Hackett Group trades on a P/E ratio of 21.9, which is above its market average of 18.2. The recent drop in earnings per share might keep value investors away, but the relatively strong balance sheet will allow the company time to invest in growth. Clearly, the high P/E indicates shareholders think it will!
Investors should be looking to buy stocks that the market is wrong about. People often underestimate remarkable growth -- so investors can make money when fast growth is not fully appreciated. So this free visual report on analyst forecasts could hold the key to an excellent investment decision.
But note: Hackett Group may not be the best stock to buy. So take a peek at this free list of interesting companies with strong recent earnings growth (and a P/E ratio below 20).
If you spot an error that warrants correction, please contact the editor at editorial-team@simplywallst.com. This article by Simply Wall St is general in nature. It does not constitute a recommendation to buy or sell any stock, and does not take account of your objectives, or your financial situation. Simply Wall St has no position in the stocks mentioned.
We aim to bring you long-term focused research analysis driven by fundamental data. Note that our analysis may not factor in the latest price-sensitive company announcements or qualitative material. Thank you for reading.
About NasdaqGS:HCKT
Hackett Group
Operates as an intellectual property platform-based generative artificial intelligence strategic consulting and executive advisory digital transformation in the United States, Europe, and internationally.
Undervalued established dividend payer.
Similar Companies
Market Insights


Advertisement
Weekly Picks
CE


Ceazar on Eva Live ·
This small cap is building the AI workforce of the future
Fair Value:US$7.4353.2% undervalued
71 followersusers have followed this narrative
0 commentsusers have commented on this narrative
15 likesusers have liked this narrative
TR


tripledub on lululemon athletica ·
Lululemon Got Boring Right About the Time It Got Cheap. That's Usually the Point
Fair Value:US$22043.1% undervalued
20 followersusers have followed this narrative
6 commentsusers have commented on this narrative
23 likesusers have liked this narrative
WO


woodworthfund on Kraft Heinz ·
Kraft Heinz (KHC): Less Drama, More Ketchup
Fair Value:US$3532.8% undervalued
6 followersusers have followed this narrative
0 commentsusers have commented on this narrative
2 likesusers have liked this narrative
CA


Canderous on PetroTal ·
Beyond 2026, Beyond a Double
Fair Value:CA$1.8168.5% undervalued
23 followersusers have followed this narrative
0 commentsusers have commented on this narrative
3 likesusers have liked this narrative
Recently Updated Narratives
IV

Ivoed on OCI ·
OCI is not being priced on asset value. That is the opportunity.
Fair Value:€6.5643.8% undervalued
2 followersusers have followed this narrative
0 commentsusers have commented on this narrative
0 likesusers have liked this narrative
IV

Ivoed on Kinepolis Group ·
Kinepolis Group Set to Achieve 22.52% Revenue Growth Boost, Experts Dream
Fair Value:€4839.0% undervalued
2 followersusers have followed this narrative
0 commentsusers have commented on this narrative
0 likesusers have liked this narrative
IV

Ivoed on Salesforce ·
Salesforce Future Value Could Reach $263 as Market Remains Short-Sighted
Fair Value:US$26331.5% undervalued
2 followersusers have followed this narrative
0 commentsusers have commented on this narrative
0 likesusers have liked this narrative
Popular Narratives
GO

GoldenSands on QuantumScape ·
QuantumScape: A Mispriced Deep‑Tech Inflection Point With Multi‑Billion‑Dollar Optionality
Fair Value:US$8591.0% undervalued
114 followersusers have followed this narrative
2 commentsusers have commented on this narrative
31 likesusers have liked this narrative
TR

tripledub on Meta Platforms ·
The $135 Billion Bet That Should Make Every Shareholder Nervous
Fair Value:US$74018.2% undervalued
39 followersusers have followed this narrative
3 commentsusers have commented on this narrative
33 likesusers have liked this narrative
AN


AnalystConsensusTarget on NVIDIA ·
NVDA: Expanding AI Demand Will Drive Major Data Center Investments Through 2026
Fair Value:US$268.6116.8% undervalued
1187 followersusers have followed this narrative
7 commentsusers have commented on this narrative
34 likesusers have liked this narrative