Advertisement
- Austria
- /
- Construction
- /
- WBAG:STR
Does Strabag SE (VIE:STR) Have A Good P/E Ratio?
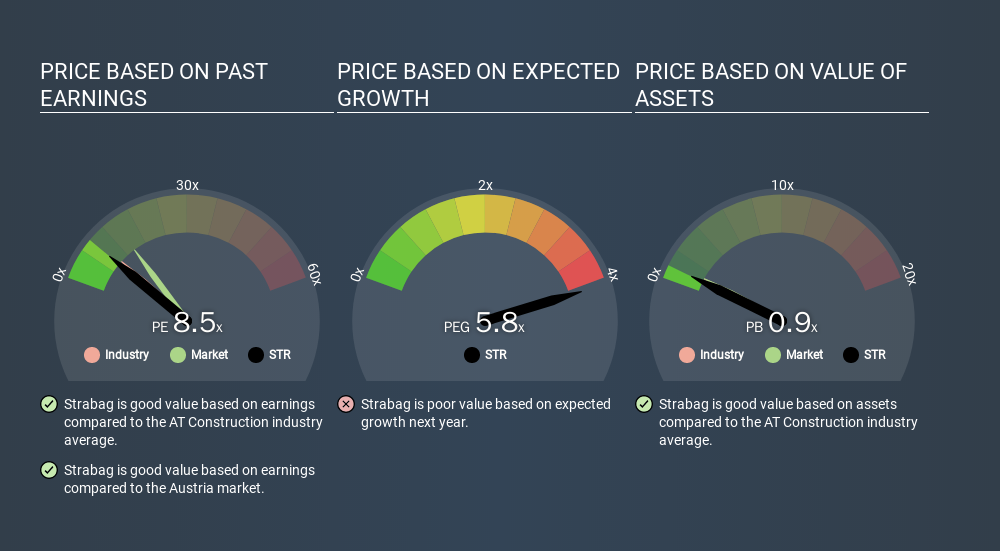
Today, we'll introduce the concept of the P/E ratio for those who are learning about investing. We'll look at Strabag SE's (VIE:STR) P/E ratio and reflect on what it tells us about the company's share price. What is Strabag's P/E ratio? Well, based on the last twelve months it is 8.52. That corresponds to an earnings yield of approximately 11.7%.
View our latest analysis for Strabag
How Do You Calculate A P/E Ratio?
The formula for price to earnings is:
Price to Earnings Ratio = Price per Share ÷ Earnings per Share (EPS)
Or for Strabag:
P/E of 8.52 = EUR30.30 ÷ EUR3.56 (Based on the year to June 2019.)
Is A High Price-to-Earnings Ratio Good?
A higher P/E ratio implies that investors pay a higher price for the earning power of the business. All else being equal, it's better to pay a low price -- but as Warren Buffett said, 'It's far better to buy a wonderful company at a fair price than a fair company at a wonderful price'.
Does Strabag Have A Relatively High Or Low P/E For Its Industry?
We can get an indication of market expectations by looking at the P/E ratio. The image below shows that Strabag has a lower P/E than the average (9.6) P/E for companies in the construction industry.
This suggests that market participants think Strabag will underperform other companies in its industry. While current expectations are low, the stock could be undervalued if the situation is better than the market assumes. If you consider the stock interesting, further research is recommended. For example, I often monitor director buying and selling.
How Growth Rates Impact P/E Ratios
Earnings growth rates have a big influence on P/E ratios. If earnings are growing quickly, then the 'E' in the equation will increase faster than it would otherwise. That means unless the share price increases, the P/E will reduce in a few years. Then, a lower P/E should attract more buyers, pushing the share price up.
Most would be impressed by Strabag earnings growth of 10% in the last year. And its annual EPS growth rate over 5 years is 24%. So one might expect an above average P/E ratio.
A Limitation: P/E Ratios Ignore Debt and Cash In The Bank
It's important to note that the P/E ratio considers the market capitalization, not the enterprise value. So it won't reflect the advantage of cash, or disadvantage of debt. The exact same company would hypothetically deserve a higher P/E ratio if it had a strong balance sheet, than if it had a weak one with lots of debt, because a cashed up company can spend on growth.
Spending on growth might be good or bad a few years later, but the point is that the P/E ratio does not account for the option (or lack thereof).
How Does Strabag's Debt Impact Its P/E Ratio?
Strabag has net cash of €350m. This is fairly high at 11% of its market capitalization. That might mean balance sheet strength is important to the business, but should also help push the P/E a bit higher than it would otherwise be.
The Bottom Line On Strabag's P/E Ratio
Strabag has a P/E of 8.5. That's below the average in the AT market, which is 14.2. It grew its EPS nicely over the last year, and the healthy balance sheet implies there is more potential for growth. The relatively low P/E ratio implies the market is pessimistic.
Investors have an opportunity when market expectations about a stock are wrong. If it is underestimating a company, investors can make money by buying and holding the shares until the market corrects itself. So this free report on the analyst consensus forecasts could help you make a master move on this stock.
But note: Strabag may not be the best stock to buy. So take a peek at this free list of interesting companies with strong recent earnings growth (and a P/E ratio below 20).
If you spot an error that warrants correction, please contact the editor at editorial-team@simplywallst.com. This article by Simply Wall St is general in nature. It does not constitute a recommendation to buy or sell any stock, and does not take account of your objectives, or your financial situation. Simply Wall St has no position in the stocks mentioned.
We aim to bring you long-term focused research analysis driven by fundamental data. Note that our analysis may not factor in the latest price-sensitive company announcements or qualitative material. Thank you for reading.
About WBAG:STR
Strabag
Engages in the construction projects.
Flawless balance sheet, good value and pays a dividend.
Similar Companies
Market Insights


Advertisement
Weekly Picks
LO


Lou_Basenese on Virtuix Holdings ·
From a “Shark Tank” Snub to an Air Force “Yes”: Why Virtuix at $3.50 May Be the Market’s Most Mispriced AI Story
Fair Value:US$7.559.3% undervalued
33 followersusers have followed this narrative
0 commentsusers have commented on this narrative
6 likesusers have liked this narrative
HE


HedgeY on IonQ ·
The Best-Funded Quantum Platform and Still a Stock Priced for Perfection
Fair Value:US$4811.0% overvalued
19 followersusers have followed this narrative
0 commentsusers have commented on this narrative
4 likesusers have liked this narrative
BL


BlackGoat on Cerebras Systems ·
The Wafer Giant Threatening NVIDIA's GPU Hegemony
Fair Value:US$415.5446.8% undervalued
31 followersusers have followed this narrative
1 commentusers have commented on this narrative
7 likesusers have liked this narrative
IV

Ivoed on Netflix ·
Netflix’s Business Quality Is Clear. The Harder Question Is Whether The Stock Is Still Cheap
Fair Value:US$8212.9% undervalued
19 followersusers have followed this narrative
0 commentsusers have commented on this narrative
7 likesusers have liked this narrative
Recently Updated Narratives
BR

Bravosatya on Meta Platforms ·
Meta Platforms - Zuckerberg’s investment decisions are impulsive or Prudent?
Fair Value:US$730.0222.8% undervalued
2 followersusers have followed this narrative
0 commentsusers have commented on this narrative
0 likesusers have liked this narrative
JU

julio on FIGS ·
Figs valuation
Fair Value:US$14.3928.9% undervalued
20 followersusers have followed this narrative
6 commentsusers have commented on this narrative
0 likesusers have liked this narrative
AS


AstrisCorporateAdvisory on MIRAI ·
Improving NOI growth visibility on wider rent gap
Fair Value:JP¥77.06k46.1% undervalued
1 followerusers have followed this narrative
0 commentsusers have commented on this narrative
0 likesusers have liked this narrative
Popular Narratives
IN


Investingwilly on Mastercard ·
Mastercard: The Best Dividend Stock You're Ignoring
Fair Value:US$75031.5% undervalued
79 followersusers have followed this narrative
1 commentusers have commented on this narrative
9 likesusers have liked this narrative
HA


HarishPK on Adobe ·
Adobe: A Probabilistic Case for Undervaluation
Fair Value:US$319.9635.9% undervalued
62 followersusers have followed this narrative
9 commentsusers have commented on this narrative
19 likesusers have liked this narrative
MA


martinarauz on Nu Holdings ·
Investment Analysis (May 2026)
Fair Value:US$22.7441.2% undervalued
68 followersusers have followed this narrative
0 commentsusers have commented on this narrative
17 likesusers have liked this narrative