Advertisement
- France
- /
- Semiconductors
- /
- ENXTPA:STMPA
Does STMicroelectronics N.V.'s (EPA:STM) P/E Ratio Signal A Buying Opportunity?
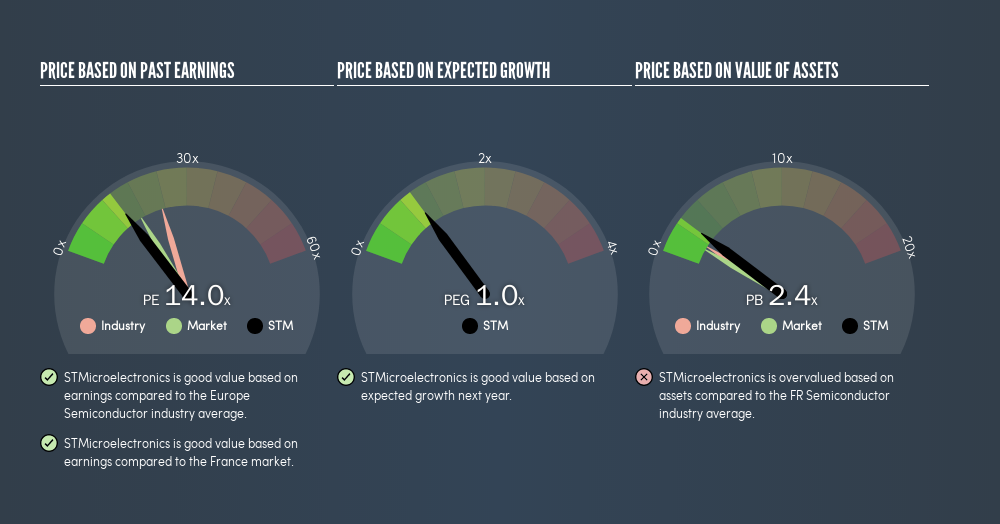
Today, we'll introduce the concept of the P/E ratio for those who are learning about investing. We'll look at STMicroelectronics N.V.'s (EPA:STM) P/E ratio and reflect on what it tells us about the company's share price. STMicroelectronics has a price to earnings ratio of 13.98, based on the last twelve months. That corresponds to an earnings yield of approximately 7.2%.
See our latest analysis for STMicroelectronics
How Do You Calculate STMicroelectronics's P/E Ratio?
The formula for price to earnings is:
Price to Earnings Ratio = Share Price (in reporting currency) ÷ Earnings per Share (EPS)
Or for STMicroelectronics:
P/E of 13.98 = $17.5 (Note: this is the share price in the reporting currency, namely, USD ) ÷ $1.25 (Based on the year to June 2019.)
Is A High Price-to-Earnings Ratio Good?
A higher P/E ratio implies that investors pay a higher price for the earning power of the business. All else being equal, it's better to pay a low price -- but as Warren Buffett said, 'It's far better to buy a wonderful company at a fair price than a fair company at a wonderful price.'
How Does STMicroelectronics's P/E Ratio Compare To Its Peers?
The P/E ratio essentially measures market expectations of a company. We can see in the image below that the average P/E (22.9) for companies in the semiconductor industry is higher than STMicroelectronics's P/E.
Its relatively low P/E ratio indicates that STMicroelectronics shareholders think it will struggle to do as well as other companies in its industry classification.
How Growth Rates Impact P/E Ratios
Earnings growth rates have a big influence on P/E ratios. That's because companies that grow earnings per share quickly will rapidly increase the 'E' in the equation. That means unless the share price increases, the P/E will reduce in a few years. So while a stock may look expensive based on past earnings, it could be cheap based on future earnings.
STMicroelectronics saw earnings per share improve by -7.0% last year. And its annual EPS growth rate over 3 years is 146%.
Don't Forget: The P/E Does Not Account For Debt or Bank Deposits
Don't forget that the P/E ratio considers market capitalization. That means it doesn't take debt or cash into account. Hypothetically, a company could reduce its future P/E ratio by spending its cash (or taking on debt) to achieve higher earnings.
Such expenditure might be good or bad, in the long term, but the point here is that the balance sheet is not reflected by this ratio.
How Does STMicroelectronics's Debt Impact Its P/E Ratio?
STMicroelectronics has net cash of US$248m. That should lead to a higher P/E than if it did have debt, because its strong balance sheets gives it more options.
The Verdict On STMicroelectronics's P/E Ratio
STMicroelectronics has a P/E of 14. That's below the average in the FR market, which is 17. EPS was up modestly better over the last twelve months. And the healthy balance sheet means the company can sustain growth while the P/E suggests shareholders don't think it will.
Investors should be looking to buy stocks that the market is wrong about. If it is underestimating a company, investors can make money by buying and holding the shares until the market corrects itself. So this free report on the analyst consensus forecasts could help you make a master move on this stock.
Of course you might be able to find a better stock than STMicroelectronics. So you may wish to see this free collection of other companies that have grown earnings strongly.
We aim to bring you long-term focused research analysis driven by fundamental data. Note that our analysis may not factor in the latest price-sensitive company announcements or qualitative material.
If you spot an error that warrants correction, please contact the editor at editorial-team@simplywallst.com. This article by Simply Wall St is general in nature. It does not constitute a recommendation to buy or sell any stock, and does not take account of your objectives, or your financial situation. Simply Wall St has no position in the stocks mentioned. Thank you for reading.
About ENXTPA:STMPA
STMicroelectronics
Designs, develops, manufactures, and sells semiconductor products in Europe, the Middle East, Africa, the Americas, and the Asia Pacific.
Flawless balance sheet with reasonable growth potential.
Similar Companies
Market Insights


Advertisement
Weekly Picks
CE


Ceazar on Sparc Al ·
When GPS fails: this small cap is fixing a $54B drone problem
Fair Value:CA$5.254.8% undervalued
27 followersusers have followed this narrative
0 commentsusers have commented on this narrative
6 likesusers have liked this narrative
SO

sorkdhkddlek on Marvell Technology ·
From AI Infrastructure Plumber to Full-Stack AI Factory Architect
Fair Value:US$14017.8% overvalued
18 followersusers have followed this narrative
0 commentsusers have commented on this narrative
6 likesusers have liked this narrative
MI


MiningStockAnalyst on Aurelia Metals ·
Aurelia Metals Limited — Transitioning Into a Higher-Quality Mid-Tier Producer
Fair Value:AU$0.426.3% undervalued
12 followersusers have followed this narrative
0 commentsusers have commented on this narrative
5 likesusers have liked this narrative
CO


composite32 on TotalEnergies ·
Is This strategic transformation of TTE? Significant re-rating potential
Fair Value:€88.2910.2% undervalued
17 followersusers have followed this narrative
2 commentsusers have commented on this narrative
3 likesusers have liked this narrative
Recently Updated Narratives
HE

heartwood on Adobe ·
Classic Value Trap
Fair Value:US$163.2353.6% overvalued
1 followerusers have followed this narrative
0 commentsusers have commented on this narrative
0 likesusers have liked this narrative
RO


RockeTeller on Polymetals Resources ·
13x Aussie Polymetal Silver/Zinc/Lead Project
Fair Value:AU$15.5294.3% undervalued
2 followersusers have followed this narrative
1 commentusers have commented on this narrative
1 likeusers have liked this narrative
MA

Marvellous on MTN Nigeria Communications ·
I believe MTN Nigeria Communications has strong long-term potential due to its market dominance, growing data demand, and fintech expansion.
Fair Value:₦757.3120.8% overvalued
1 followerusers have followed this narrative
0 commentsusers have commented on this narrative
0 likesusers have liked this narrative
Popular Narratives
KI

Kingman1152 on NVIDIA ·
NVIDIA will see a profit margin surge of 55% in the next 5 years
Fair Value:US$305.235.0% undervalued
68 followersusers have followed this narrative
2 commentsusers have commented on this narrative
24 likesusers have liked this narrative
AN


AnalystConsensusTarget on Microsoft ·
Analyst Commentary Highlights Microsoft AI Momentum and Upward Valuation Amid Growth and Competitive Risks
Fair Value:US$561.9326.2% undervalued
1394 followersusers have followed this narrative
2 commentsusers have commented on this narrative
11 likesusers have liked this narrative
TR


tripledub on Meta Platforms ·
The $135 Billion Bet That Should Make Every Shareholder Nervous
Fair Value:US$74017.7% undervalued
31 followersusers have followed this narrative
3 commentsusers have commented on this narrative
32 likesusers have liked this narrative