
Advertisement
- United States
- /
- Professional Services
- /
- NYSE:TNET
Can TriNet Group, Inc.'s (NYSE:TNET) ROE Continue To Surpass The Industry Average?

While some investors are already well versed in financial metrics (hat tip), this article is for those who would like to learn about Return On Equity (ROE) and why it is important. To keep the lesson grounded in practicality, we'll use ROE to better understand TriNet Group, Inc. (NYSE:TNET).
Return on Equity or ROE is a test of how effectively a company is growing its value and managing investors’ money. Simply put, it is used to assess the profitability of a company in relation to its equity capital.
View our latest analysis for TriNet Group
How Is ROE Calculated?
The formula for return on equity is:
Return on Equity = Net Profit (from continuing operations) ÷ Shareholders' Equity
So, based on the above formula, the ROE for TriNet Group is:
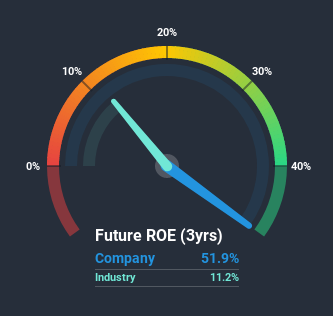
52% = US$320m ÷ US$616m (Based on the trailing twelve months to June 2020).
The 'return' is the profit over the last twelve months. One way to conceptualize this is that for each $1 of shareholders' capital it has, the company made $0.52 in profit.
Does TriNet Group Have A Good Return On Equity?
One simple way to determine if a company has a good return on equity is to compare it to the average for its industry. However, this method is only useful as a rough check, because companies do differ quite a bit within the same industry classification. As is clear from the image below, TriNet Group has a better ROE than the average (11%) in the Professional Services industry.
That's what we like to see. With that said, a high ROE doesn't always indicate high profitability. A higher proportion of debt in a company's capital structure may also result in a high ROE, where the high debt levels could be a huge risk . You can see the 2 risks we have identified for TriNet Group by visiting our risks dashboard for free on our platform here.
Why You Should Consider Debt When Looking At ROE
Companies usually need to invest money to grow their profits. That cash can come from issuing shares, retained earnings, or debt. In the first two cases, the ROE will capture this use of capital to grow. In the latter case, the debt required for growth will boost returns, but will not impact the shareholders' equity. That will make the ROE look better than if no debt was used.
TriNet Group's Debt And Its 52% ROE
TriNet Group does use a high amount of debt to increase returns. It has a debt to equity ratio of 1.00. There's no doubt the ROE is impressive, but it's worth keeping in mind that the metric could have been lower if the company were to reduce its debt. Debt increases risk and reduces options for the company in the future, so you generally want to see some good returns from using it.
Conclusion
Return on equity is useful for comparing the quality of different businesses. In our books, the highest quality companies have high return on equity, despite low debt. All else being equal, a higher ROE is better.
But when a business is high quality, the market often bids it up to a price that reflects this. Profit growth rates, versus the expectations reflected in the price of the stock, are a particularly important to consider. So I think it may be worth checking this free report on analyst forecasts for the company.
But note: TriNet Group may not be the best stock to buy. So take a peek at this free list of interesting companies with high ROE and low debt.
When trading TriNet Group or any other investment, use the platform considered by many to be the Professional's Gateway to the Worlds Market, Interactive Brokers. You get the lowest-cost* trading on stocks, options, futures, forex, bonds and funds worldwide from a single integrated account. Promoted
Valuation is complex, but we're here to simplify it.
Discover if TriNet Group might be undervalued or overvalued with our detailed analysis, featuring fair value estimates, potential risks, dividends, insider trades, and its financial condition.
Access Free AnalysisThis article by Simply Wall St is general in nature. It does not constitute a recommendation to buy or sell any stock, and does not take account of your objectives, or your financial situation. We aim to bring you long-term focused analysis driven by fundamental data. Note that our analysis may not factor in the latest price-sensitive company announcements or qualitative material. Simply Wall St has no position in any stocks mentioned.
*Interactive Brokers Rated Lowest Cost Broker by StockBrokers.com Annual Online Review 2020
Have feedback on this article? Concerned about the content? Get in touch with us directly. Alternatively, email editorial-team@simplywallst.com.
About NYSE:TNET
TriNet Group
Provides comprehensive and flexible human capital management services for small and medium size businesses in the United States.
Adequate balance sheet with limited growth.
Similar Companies
Market Insights

Advertisement
Community Narratives
Groundbreaking therapies that could change the treatment landscape for PTSD, fibromyalgia, MS & Alzheimer’s
Fair Value US$6.20|86.9% undervalued
CM
Community Contributor
DigitalOcean Will Grow 14% by Embracing AI with Paperspace Acquisition
Fair Value US$50.00|41.7% undervalued
NE
Community Contributor
Viant Technology: A Rising AdTech Challenger in the AI-Powered CTV Market
Fair Value US$38.61|63.2% undervalued
BL
Community Contributor
Volvo will Accelerate Forward into Electric and Autonomous Leadership in Five Years
Fair Value SEK 438.80|39.7% undervalued
UN
Community Contributor