
Advertisement
- India
- /
- Consumer Durables
- /
- NSEI:DIXON
Can Dixon Technologies (India) (NSE:DIXON) Keep Up These Impressive Returns?

There are a few key trends to look for if we want to identify the next multi-bagger. Amongst other things, we'll want to see two things; firstly, a growing return on capital employed (ROCE) and secondly, an expansion in the company's amount of capital employed. Ultimately, this demonstrates that it's a business that is reinvesting profits at increasing rates of return. That's why when we briefly looked at Dixon Technologies (India)'s (NSE:DIXON) ROCE trend, we were very happy with what we saw.
Understanding Return On Capital Employed (ROCE)
If you haven't worked with ROCE before, it measures the 'return' (pre-tax profit) a company generates from capital employed in its business. To calculate this metric for Dixon Technologies (India), this is the formula:
Return on Capital Employed = Earnings Before Interest and Tax (EBIT) ÷ (Total Assets - Current Liabilities)
0.22 = ₹1.5b ÷ (₹17b - ₹10b) (Based on the trailing twelve months to June 2020).
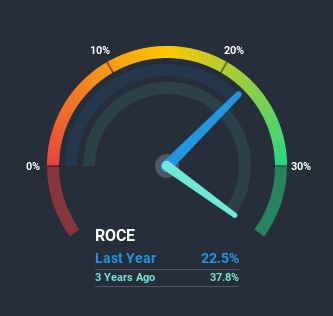
So, Dixon Technologies (India) has an ROCE of 22%. In absolute terms that's a great return and it's even better than the Consumer Durables industry average of 9.7%.
Check out our latest analysis for Dixon Technologies (India)
In the above chart we have measured Dixon Technologies (India)'s prior ROCE against its prior performance, but the future is arguably more important. If you'd like to see what analysts are forecasting going forward, you should check out our free report for Dixon Technologies (India).
So How Is Dixon Technologies (India)'s ROCE Trending?
Dixon Technologies (India) deserves to be commended in regards to it's returns. Over the past five years, ROCE has remained relatively flat at around 22% and the business has deployed 390% more capital into its operations. Returns like this are the envy of most businesses and given it has repeatedly reinvested at these rates, that's even better. You'll see this when looking at well operated businesses or favorable business models.
Another thing to note, Dixon Technologies (India) has a high ratio of current liabilities to total assets of 61%. This effectively means that suppliers (or short-term creditors) are funding a large portion of the business, so just be aware that this can introduce some elements of risk. While it's not necessarily a bad thing, it can be beneficial if this ratio is lower.What We Can Learn From Dixon Technologies (India)'s ROCE
In short, we'd argue Dixon Technologies (India) has the makings of a multi-bagger since its been able to compound its capital at very profitable rates of return. On top of that, the stock has rewarded shareholders with a remarkable 211% return to those who've held over the last three years. So while the positive underlying trends may be accounted for by investors, we still think this stock is worth looking into further.
If you want to continue researching Dixon Technologies (India), you might be interested to know about the 3 warning signs that our analysis has discovered.
If you want to search for more stocks that have been earning high returns, check out this free list of stocks with solid balance sheets that are also earning high returns on equity.
When trading Dixon Technologies (India) or any other investment, use the platform considered by many to be the Professional's Gateway to the Worlds Market, Interactive Brokers. You get the lowest-cost* trading on stocks, options, futures, forex, bonds and funds worldwide from a single integrated account. Promoted
New: Manage All Your Stock Portfolios in One Place
We've created the ultimate portfolio companion for stock investors, and it's free.
• Connect an unlimited number of Portfolios and see your total in one currency
• Be alerted to new Warning Signs or Risks via email or mobile
• Track the Fair Value of your stocks
This article by Simply Wall St is general in nature. It does not constitute a recommendation to buy or sell any stock, and does not take account of your objectives, or your financial situation. We aim to bring you long-term focused analysis driven by fundamental data. Note that our analysis may not factor in the latest price-sensitive company announcements or qualitative material. Simply Wall St has no position in any stocks mentioned.
*Interactive Brokers Rated Lowest Cost Broker by StockBrokers.com Annual Online Review 2020
Have feedback on this article? Concerned about the content? Get in touch with us directly. Alternatively, email editorial-team@simplywallst.com.
About NSEI:DIXON
Dixon Technologies (India)
Engages in the provision of electronic manufacturing services in India and internationally.
Exceptional growth potential with solid track record.
Similar Companies
Market Insights

Advertisement
Community Narratives
The Most Undervalued of the Magnificent 7
Fair Value US$237.43|36.3% undervalued
IN
Community Contributor
PVA TePla's New Strategy Aims for 22% Revenue Growth in Semiconductor Recovery
Fair Value €19.19|20.8% undervalued
MI
Community Contributor