Benign Growth For S.P. Apparels Limited (NSE:SPAL) Underpins Its Share Price

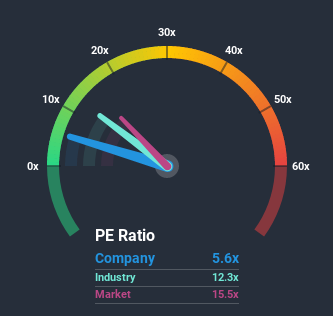
With a price-to-earnings (or "P/E") ratio of 5.6x S.P. Apparels Limited (NSE:SPAL) may be sending very bullish signals at the moment, given that almost half of all companies in India have P/E ratios greater than 16x and even P/E's higher than 39x are not unusual. Although, it's not wise to just take the P/E at face value as there may be an explanation why it's so limited.
S.P. Apparels has been struggling lately as its earnings have declined faster than most other companies. It seems that many are expecting the dismal earnings performance to persist, which has repressed the P/E. If you still like the company, you'd want its earnings trajectory to turn around before making any decisions. If not, then existing shareholders will probably struggle to get excited about the future direction of the share price.
See our latest analysis for S.P. Apparels

Does Growth Match The Low P/E?
S.P. Apparels' P/E ratio would be typical for a company that's expected to deliver very poor growth or even falling earnings, and importantly, perform much worse than the market.
Taking a look back first, the company's earnings per share growth last year wasn't something to get excited about as it posted a disappointing decline of 36%. The last three years don't look nice either as the company has shrunk EPS by 14% in aggregate. Accordingly, shareholders would have felt downbeat about the medium-term rates of earnings growth.
Looking ahead now, EPS is anticipated to slump, contracting by 27% during the coming year according to the sole analyst following the company. With the market predicted to deliver 9.7% growth , that's a disappointing outcome.
In light of this, it's understandable that S.P. Apparels' P/E would sit below the majority of other companies. However, shrinking earnings are unlikely to lead to a stable P/E over the longer term. There's potential for the P/E to fall to even lower levels if the company doesn't improve its profitability.
The Final Word
While the price-to-earnings ratio shouldn't be the defining factor in whether you buy a stock or not, it's quite a capable barometer of earnings expectations.
We've established that S.P. Apparels maintains its low P/E on the weakness of its forecast for sliding earnings, as expected. At this stage investors feel the potential for an improvement in earnings isn't great enough to justify a higher P/E ratio. Unless these conditions improve, they will continue to form a barrier for the share price around these levels.
Don't forget that there may be other risks. For instance, we've identified 4 warning signs for S.P. Apparels (1 doesn't sit too well with us) you should be aware of.
It's important to make sure you look for a great company, not just the first idea you come across. So take a peek at this free list of interesting companies with strong recent earnings growth (and a P/E ratio below 20x).
If you’re looking to trade S.P. Apparels, open an account with the lowest-cost* platform trusted by professionals, Interactive Brokers. Their clients from over 200 countries and territories trade stocks, options, futures, forex, bonds and funds worldwide from a single integrated account. Promoted
New: Manage All Your Stock Portfolios in One Place
We've created the ultimate portfolio companion for stock investors, and it's free.
• Connect an unlimited number of Portfolios and see your total in one currency
• Be alerted to new Warning Signs or Risks via email or mobile
• Track the Fair Value of your stocks
This article by Simply Wall St is general in nature. It does not constitute a recommendation to buy or sell any stock, and does not take account of your objectives, or your financial situation. We aim to bring you long-term focused analysis driven by fundamental data. Note that our analysis may not factor in the latest price-sensitive company announcements or qualitative material. Simply Wall St has no position in any stocks mentioned.
*Interactive Brokers Rated Lowest Cost Broker by StockBrokers.com Annual Online Review 2020
Have feedback on this article? Concerned about the content? Get in touch with us directly. Alternatively, email editorial-team@simplywallst.com.
About NSEI:SPAL
S.P. Apparels
Engages in manufacturing and exporting of knitted garments for infants and children in India and internationally.
Flawless balance sheet and undervalued.

