Stock Analysis
- United States
- /
- Insurance
- /
- NYSE:MCY
Mercury General (NYSE:MCY) delivers shareholders decent 83% return over 1 year, surging 4.9% in the last week alone


These days it's easy to simply buy an index fund, and your returns should (roughly) match the market. But investors can boost returns by picking market-beating companies to own shares in. For example, the Mercury General Corporation (NYSE:MCY) share price is up 76% in the last 1 year, clearly besting the market return of around 20% (not including dividends). If it can keep that out-performance up over the long term, investors will do very well! In contrast, the longer term returns are negative, since the share price is 18% lower than it was three years ago.
Since the stock has added US$138m to its market cap in the past week alone, let's see if underlying performance has been driving long-term returns.
See our latest analysis for Mercury General
While the efficient markets hypothesis continues to be taught by some, it has been proven that markets are over-reactive dynamic systems, and investors are not always rational. One flawed but reasonable way to assess how sentiment around a company has changed is to compare the earnings per share (EPS) with the share price.
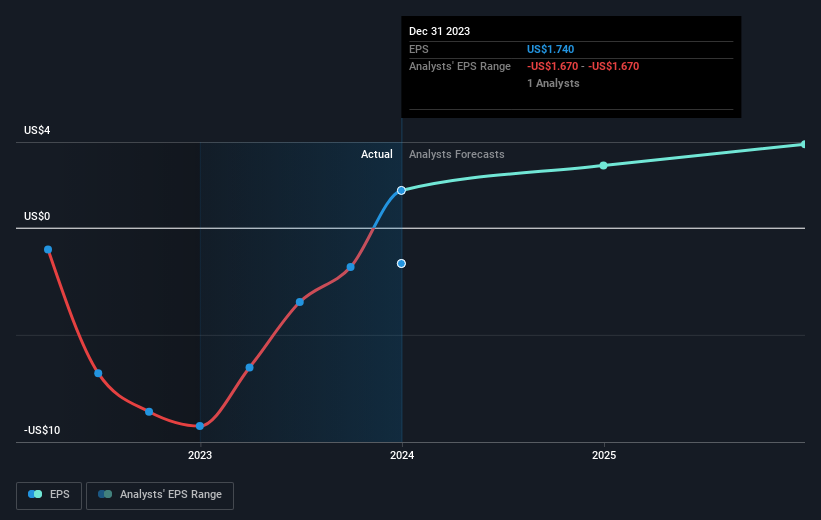
During the last year Mercury General grew its earnings per share, moving from a loss to a profit.
The result looks like a strong improvement to us, so we're not surprised the market likes the growth. Generally speaking the profitability inflection point is a great time to research a company closely, lest you miss an opportunity to profit.
The graphic below depicts how EPS has changed over time (unveil the exact values by clicking on the image).
It's probably worth noting that the CEO is paid less than the median at similar sized companies. But while CEO remuneration is always worth checking, the really important question is whether the company can grow earnings going forward. This free interactive report on Mercury General's earnings, revenue and cash flow is a great place to start, if you want to investigate the stock further.
What About Dividends?
When looking at investment returns, it is important to consider the difference between total shareholder return (TSR) and share price return. The TSR is a return calculation that accounts for the value of cash dividends (assuming that any dividend received was reinvested) and the calculated value of any discounted capital raisings and spin-offs. It's fair to say that the TSR gives a more complete picture for stocks that pay a dividend. We note that for Mercury General the TSR over the last 1 year was 83%, which is better than the share price return mentioned above. And there's no prize for guessing that the dividend payments largely explain the divergence!
A Different Perspective
We're pleased to report that Mercury General shareholders have received a total shareholder return of 83% over one year. Of course, that includes the dividend. Since the one-year TSR is better than the five-year TSR (the latter coming in at 5% per year), it would seem that the stock's performance has improved in recent times. Given the share price momentum remains strong, it might be worth taking a closer look at the stock, lest you miss an opportunity. While it is well worth considering the different impacts that market conditions can have on the share price, there are other factors that are even more important. Consider risks, for instance. Every company has them, and we've spotted 1 warning sign for Mercury General you should know about.
For those who like to find winning investments this free list of growing companies with recent insider purchasing, could be just the ticket.
Please note, the market returns quoted in this article reflect the market weighted average returns of stocks that currently trade on American exchanges.
Valuation is complex, but we're helping make it simple.
Find out whether Mercury General is potentially over or undervalued by checking out our comprehensive analysis, which includes fair value estimates, risks and warnings, dividends, insider transactions and financial health.
View the Free AnalysisHave feedback on this article? Concerned about the content? Get in touch with us directly. Alternatively, email editorial-team (at) simplywallst.com.
This article by Simply Wall St is general in nature. We provide commentary based on historical data and analyst forecasts only using an unbiased methodology and our articles are not intended to be financial advice. It does not constitute a recommendation to buy or sell any stock, and does not take account of your objectives, or your financial situation. We aim to bring you long-term focused analysis driven by fundamental data. Note that our analysis may not factor in the latest price-sensitive company announcements or qualitative material. Simply Wall St has no position in any stocks mentioned.
About NYSE:MCY
Mercury General
Mercury General Corporation, together with its subsidiaries, engages in writing personal automobile insurance in the United States.
Reasonable growth potential with acceptable track record.
