Stock Analysis
- Australia
- /
- Metals and Mining
- /
- ASX:BHP
BHP Group Limited's (ASX:BHP) Stock Has Seen Strong Momentum: Does That Call For Deeper Study Of Its Financial Prospects?
BHP Group's (ASX:BHP) stock is up by a considerable 6.2% over the past month. Given that stock prices are usually aligned with a company's financial performance in the long-term, we decided to study its financial indicators more closely to see if they had a hand to play in the recent price move. Specifically, we decided to study BHP Group's ROE in this article.
Return on equity or ROE is an important factor to be considered by a shareholder because it tells them how effectively their capital is being reinvested. Simply put, it is used to assess the profitability of a company in relation to its equity capital.
View our latest analysis for BHP Group
How Do You Calculate Return On Equity?
The formula for return on equity is:
Return on Equity = Net Profit (from continuing operations) ÷ Shareholders' Equity
So, based on the above formula, the ROE for BHP Group is:
20% = US$8.9b ÷ US$46b (Based on the trailing twelve months to December 2023).
The 'return' is the amount earned after tax over the last twelve months. That means that for every A$1 worth of shareholders' equity, the company generated A$0.20 in profit.
What Is The Relationship Between ROE And Earnings Growth?
We have already established that ROE serves as an efficient profit-generating gauge for a company's future earnings. We now need to evaluate how much profit the company reinvests or "retains" for future growth which then gives us an idea about the growth potential of the company. Generally speaking, other things being equal, firms with a high return on equity and profit retention, have a higher growth rate than firms that don’t share these attributes.
BHP Group's Earnings Growth And 20% ROE
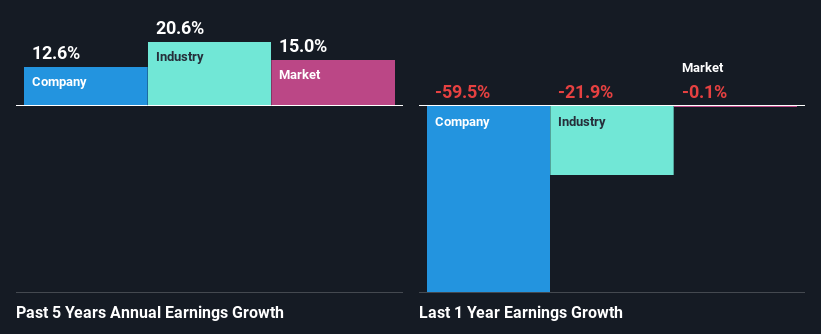
To begin with, BHP Group seems to have a respectable ROE. On comparing with the average industry ROE of 10% the company's ROE looks pretty remarkable. This certainly adds some context to BHP Group's decent 13% net income growth seen over the past five years.
Next, on comparing with the industry net income growth, we found that BHP Group's reported growth was lower than the industry growth of 21% over the last few years, which is not something we like to see.
Earnings growth is an important metric to consider when valuing a stock. The investor should try to establish if the expected growth or decline in earnings, whichever the case may be, is priced in. By doing so, they will have an idea if the stock is headed into clear blue waters or if swampy waters await. Has the market priced in the future outlook for BHP? You can find out in our latest intrinsic value infographic research report.
Is BHP Group Using Its Retained Earnings Effectively?
BHP Group has a significant three-year median payout ratio of 94%, meaning that it is left with only 5.6% to reinvest into its business. This implies that the company has been able to achieve decent earnings growth despite returning most of its profits to shareholders.
Moreover, BHP Group is determined to keep sharing its profits with shareholders which we infer from its long history of paying a dividend for at least ten years. Our latest analyst data shows that the future payout ratio of the company is expected to drop to 59% over the next three years. Regardless, the ROE is not expected to change much for the company despite the lower expected payout ratio.
Summary
On the whole, we do feel that BHP Group has some positive attributes. Its earnings have grown respectably as we saw earlier, probably due to its high returns. However, it does reinvest little to almost none of its profits, so we wonder what effect this could have on its future growth prospects. We also studied the latest analyst forecasts and found that the company's earnings growth is expected be similar to its current growth rate. To know more about the company's future earnings growth forecasts take a look at this free report on analyst forecasts for the company to find out more.
Valuation is complex, but we're helping make it simple.
Find out whether BHP Group is potentially over or undervalued by checking out our comprehensive analysis, which includes fair value estimates, risks and warnings, dividends, insider transactions and financial health.
View the Free AnalysisHave feedback on this article? Concerned about the content? Get in touch with us directly. Alternatively, email editorial-team (at) simplywallst.com.
This article by Simply Wall St is general in nature. We provide commentary based on historical data and analyst forecasts only using an unbiased methodology and our articles are not intended to be financial advice. It does not constitute a recommendation to buy or sell any stock, and does not take account of your objectives, or your financial situation. We aim to bring you long-term focused analysis driven by fundamental data. Note that our analysis may not factor in the latest price-sensitive company announcements or qualitative material. Simply Wall St has no position in any stocks mentioned.

Simply Wall St
About ASX:BHP
BHP Group
BHP Group Limited operates as a resources company in Australia, Europe, China, Japan, India, South Korea, the rest of Asia, North America, South America, and internationally.
Excellent balance sheet second-rate dividend payer.
