Advertisement
- United States
- /
- Medical Equipment
- /
- OTCPK:ZYXI.Q
Are Zynex, Inc.’s (NASDAQ:ZYXI) High Returns Really That Great?
Today we are going to look at Zynex, Inc. (NASDAQ:ZYXI) to see whether it might be an attractive investment prospect. In particular, we'll consider its Return On Capital Employed (ROCE), as that can give us insight into how profitably the company is able to employ capital in its business.
First up, we'll look at what ROCE is and how we calculate it. Second, we'll look at its ROCE compared to similar companies. And finally, we'll look at how its current liabilities are impacting its ROCE.
What is Return On Capital Employed (ROCE)?
ROCE measures the amount of pre-tax profits a company can generate from the capital employed in its business. In general, businesses with a higher ROCE are usually better quality. In brief, it is a useful tool, but it is not without drawbacks. Renowned investment researcher Michael Mauboussin has suggested that a high ROCE can indicate that 'one dollar invested in the company generates value of more than one dollar'.
So, How Do We Calculate ROCE?
The formula for calculating the return on capital employed is:
Return on Capital Employed = Earnings Before Interest and Tax (EBIT) ÷ (Total Assets - Current Liabilities)
Or for Zynex:
0.51 = US$10m ÷ (US$25m - US$4.5m) (Based on the trailing twelve months to September 2019.)
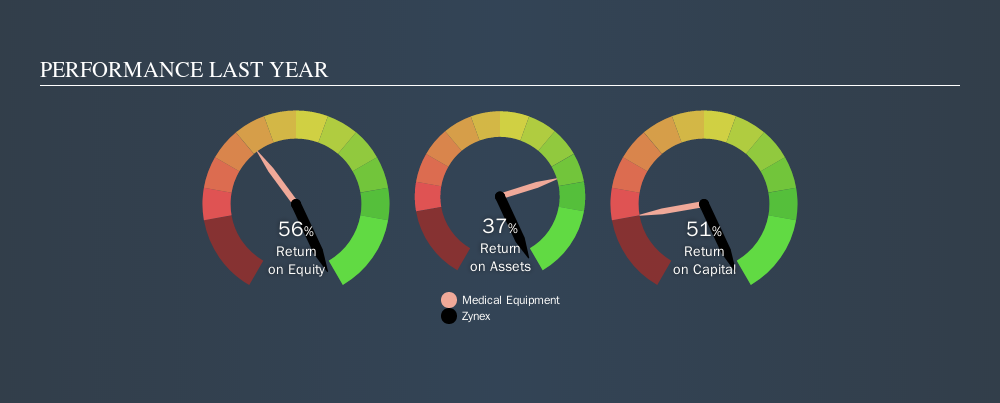
So, Zynex has an ROCE of 51%.
See our latest analysis for Zynex
Is Zynex's ROCE Good?
When making comparisons between similar businesses, investors may find ROCE useful. Zynex's ROCE appears to be substantially greater than the 9.4% average in the Medical Equipment industry. I think that's good to see, since it implies the company is better than other companies at making the most of its capital. Setting aside the comparison to its industry for a moment, Zynex's ROCE in absolute terms currently looks quite high.
You can see in the image below how Zynex's ROCE compares to its industry.
It is important to remember that ROCE shows past performance, and is not necessarily predictive. ROCE can be deceptive for cyclical businesses, as returns can look incredible in boom times, and terribly low in downturns. This is because ROCE only looks at one year, instead of considering returns across a whole cycle. Since the future is so important for investors, you should check out our free report on analyst forecasts for Zynex.
What Are Current Liabilities, And How Do They Affect Zynex's ROCE?
Liabilities, such as supplier bills and bank overdrafts, are referred to as current liabilities if they need to be paid within 12 months. Due to the way ROCE is calculated, a high level of current liabilities makes a company look as though it has less capital employed, and thus can (sometimes unfairly) boost the ROCE. To check the impact of this, we calculate if a company has high current liabilities relative to its total assets.
Zynex has total assets of US$25m and current liabilities of US$4.5m. Therefore its current liabilities are equivalent to approximately 18% of its total assets. The fairly low level of current liabilities won't have much impact on the already great ROCE.
The Bottom Line On Zynex's ROCE
With low current liabilities and a high ROCE, Zynex could be worthy of further investigation. There might be better investments than Zynex out there, but you will have to work hard to find them . These promising businesses with rapidly growing earnings might be right up your alley.
If you are like me, then you will not want to miss this free list of growing companies that insiders are buying.
We aim to bring you long-term focused research analysis driven by fundamental data. Note that our analysis may not factor in the latest price-sensitive company announcements or qualitative material.
If you spot an error that warrants correction, please contact the editor at editorial-team@simplywallst.com. This article by Simply Wall St is general in nature. It does not constitute a recommendation to buy or sell any stock, and does not take account of your objectives, or your financial situation. Simply Wall St has no position in the stocks mentioned. Thank you for reading.
About OTCPK:ZYXI.Q
Zynex
Designs, manufactures, and markets medical devices to treat chronic and acute pain, and activate and exercise muscles for rehabilitative purposes with electrical stimulation.
Moderate risk and slightly overvalued.
Market Insights


Advertisement
Weekly Picks
LO


Lou_Basenese on Virtuix Holdings ·
From a “Shark Tank” Snub to an Air Force “Yes”: Why Virtuix at $3.50 May Be the Market’s Most Mispriced AI Story
Fair Value:US$7.558.3% undervalued
15 followersusers have followed this narrative
0 commentsusers have commented on this narrative
2 likesusers have liked this narrative
IN


Investingwilly on Mastercard ·
Mastercard: The Best Dividend Stock You're Ignoring
Fair Value:US$75034.1% undervalued
58 followersusers have followed this narrative
1 commentusers have commented on this narrative
7 likesusers have liked this narrative
TR


tripledub on Intuit ·
A Wonderful Business at a Not-So-Wonderful Price
Fair Value:US$56053.2% undervalued
60 followersusers have followed this narrative
4 commentsusers have commented on this narrative
29 likesusers have liked this narrative
TA


Talos on MindWalk Holdings ·
The Asymmetric TechBio Play: MindWalk Holdings and the Valuation Disconnect
Fair Value:US$8.2781.3% undervalued
33 followersusers have followed this narrative
0 commentsusers have commented on this narrative
8 likesusers have liked this narrative
Recently Updated Narratives
GA

GaryB on Palantir Technologies ·
Palantir hits 52 week low.
Fair Value:US$274.858.7% undervalued
1 followerusers have followed this narrative
0 commentsusers have commented on this narrative
0 likesusers have liked this narrative
NO

North49_ on iShares - iShares MSCI South Korea ETF ·
EWY:US NYSE Arca iShares Msci South Korea ETF, an opportunity to diversify your tech investments.
Fair Value:US$273.4527.9% undervalued
1 followerusers have followed this narrative
0 commentsusers have commented on this narrative
0 likesusers have liked this narrative
DA


davidlsander on Ubisoft Entertainment ·
Is Ubisoft the Market’s Biggest Pricing Error? Why Forensic Value Points to €33 Per Share
Fair Value:€33.884.9% undervalued
89 followersusers have followed this narrative
7 commentsusers have commented on this narrative
1 likeusers have liked this narrative
Popular Narratives
MA


martinarauz on Nu Holdings ·
Investment Analysis (May 2026)
Fair Value:US$22.7445.2% undervalued
67 followersusers have followed this narrative
0 commentsusers have commented on this narrative
16 likesusers have liked this narrative
HA


HarishPK on Adobe ·
Adobe: A Probabilistic Case for Undervaluation
Fair Value:US$319.9638.6% undervalued
61 followersusers have followed this narrative
9 commentsusers have commented on this narrative
18 likesusers have liked this narrative
HE


HedgeY on AST SpaceMobile ·
AST SpaceMobile: The Boldest Direct-to-Cell Bet in Public Markets
Fair Value:US$17060.0% undervalued
51 followersusers have followed this narrative
0 commentsusers have commented on this narrative
14 likesusers have liked this narrative
