Advertisement
Are Renishaw plc’s (LON:RSW) High Returns Really That Great?
Today we'll look at Renishaw plc (LON:RSW) and reflect on its potential as an investment. Specifically, we'll consider its Return On Capital Employed (ROCE), since that will give us an insight into how efficiently the business can generate profits from the capital it requires.
First of all, we'll work out how to calculate ROCE. Then we'll compare its ROCE to similar companies. Last but not least, we'll look at what impact its current liabilities have on its ROCE.
What is Return On Capital Employed (ROCE)?
ROCE measures the amount of pre-tax profits a company can generate from the capital employed in its business. All else being equal, a better business will have a higher ROCE. Overall, it is a valuable metric that has its flaws. Author Edwin Whiting says to be careful when comparing the ROCE of different businesses, since 'No two businesses are exactly alike.'
How Do You Calculate Return On Capital Employed?
Analysts use this formula to calculate return on capital employed:
Return on Capital Employed = Earnings Before Interest and Tax (EBIT) ÷ (Total Assets - Current Liabilities)
Or for Renishaw:
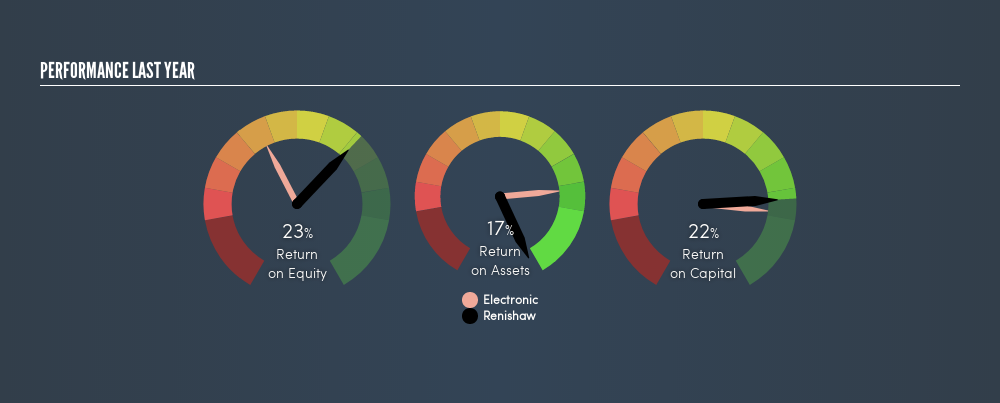
0.22 = UK£143m ÷ (UK£735m - UK£98m) (Based on the trailing twelve months to December 2018.)
Therefore, Renishaw has an ROCE of 22%.
See our latest analysis for Renishaw
Is Renishaw's ROCE Good?
One way to assess ROCE is to compare similar companies. In our analysis, Renishaw's ROCE is meaningfully higher than the 12% average in the Electronic industry. We would consider this a positive, as it suggests it is using capital more effectively than other similar companies. Regardless of the industry comparison, in absolute terms, Renishaw's ROCE currently appears to be excellent.
When considering ROCE, bear in mind that it reflects the past and does not necessarily predict the future. Companies in cyclical industries can be difficult to understand using ROCE, as returns typically look high during boom times, and low during busts. ROCE is only a point-in-time measure. Future performance is what matters, and you can see analyst predictions in our free report on analyst forecasts for the company.
How Renishaw's Current Liabilities Impact Its ROCE
Current liabilities include invoices, such as supplier payments, short-term debt, or a tax bill, that need to be paid within 12 months. Due to the way the ROCE equation works, having large bills due in the near term can make it look as though a company has less capital employed, and thus a higher ROCE than usual. To counteract this, we check if a company has high current liabilities, relative to its total assets.
Renishaw has total liabilities of UK£98m and total assets of UK£735m. Therefore its current liabilities are equivalent to approximately 13% of its total assets. A minimal amount of current liabilities limits the impact on ROCE.
The Bottom Line On Renishaw's ROCE
Low current liabilities and high ROCE is a good combination, making Renishaw look quite interesting. There might be better investments than Renishaw out there, but you will have to work hard to find them . These promising businesses with rapidly growing earnings might be right up your alley.
If you are like me, then you will not want to miss this free list of growing companies that insiders are buying.
We aim to bring you long-term focused research analysis driven by fundamental data. Note that our analysis may not factor in the latest price-sensitive company announcements or qualitative material.
If you spot an error that warrants correction, please contact the editor at editorial-team@simplywallst.com. This article by Simply Wall St is general in nature. It does not constitute a recommendation to buy or sell any stock, and does not take account of your objectives, or your financial situation. Simply Wall St has no position in the stocks mentioned. Thank you for reading.
About LSE:RSW
Renishaw
An engineering and scientific technology company, designs, manufactures, distributes, sells, and services technological products and services, and analytical instruments and medical devices worldwide.
Flawless balance sheet with reasonable growth potential.
Similar Companies
Market Insights


Advertisement
Weekly Picks
LO


Lou_Basenese on Giftify ·
Giftify ($GIFT): A Small-Cap Incentives Platform with More ScaleThan Its Valuation Suggests
Fair Value:US$2.563.5% undervalued
57 followersusers have followed this narrative
2 commentsusers have commented on this narrative
11 likesusers have liked this narrative
HA


HarishPK on lululemon athletica ·
Quantifying the Transition: Why Lululemon’s Moat Remains Intact
Fair Value:US$161.826.3% undervalued
22 followersusers have followed this narrative
2 commentsusers have commented on this narrative
9 likesusers have liked this narrative
TR


tripledub on Alphabet ·
Warren Buffett Just Bet $10 Billion on Google. The Catch? You May Already Be Too Late.
Fair Value:US$23055.3% overvalued
59 followersusers have followed this narrative
1 commentusers have commented on this narrative
16 likesusers have liked this narrative
JO


John_Eric on Veeva Systems ·
AI-Powered Veeva Systems Poised for Solid Growth Amid Regulatory Stability
Fair Value:US$32040.6% undervalued
32 followersusers have followed this narrative
0 commentsusers have commented on this narrative
6 likesusers have liked this narrative
Recently Updated Narratives
JO

John_Eric on Workday ·
Workday's Backlog Just Grew Faster Than Its Revenue.The Market Shrugged.
Fair Value:US$165.616.1% undervalued
1 followerusers have followed this narrative
0 commentsusers have commented on this narrative
0 likesusers have liked this narrative
RO


RockeTeller on Aftermath Silver ·
Aftermath Silver, A 35% Insider-Aligned Silver Stock With a Giant Critical Metals Twist
Fair Value:CA$30.3797.8% undervalued
6 followersusers have followed this narrative
2 commentsusers have commented on this narrative
1 likeusers have liked this narrative
ES

Esteban on NVR ·
NVR 05-2026
Fair Value:US$3.76k72.4% overvalued
2 followersusers have followed this narrative
0 commentsusers have commented on this narrative
0 likesusers have liked this narrative
Popular Narratives
IN


Investingwilly on Mastercard ·
Mastercard: The Best Dividend Stock You're Ignoring
Fair Value:US$75029.8% undervalued
87 followersusers have followed this narrative
1 commentusers have commented on this narrative
9 likesusers have liked this narrative
BL


BlackGoat on Cerebras Systems ·
The Wafer Giant Threatening NVIDIA's GPU Hegemony
Fair Value:US$415.5448.2% undervalued
60 followersusers have followed this narrative
3 commentsusers have commented on this narrative
11 likesusers have liked this narrative
TR
tripledub on Alphabet ·
Warren Buffett Just Bet $10 Billion on Google. The Catch? You May Already Be Too Late.
Fair Value:US$23055.3% overvalued
59 followersusers have followed this narrative
1 commentusers have commented on this narrative
16 likesusers have liked this narrative
Trending Discussion
DA


Dark_Oli on PPG Industries ·
Everywhere you look, PPG are there with paint. This compagny are a super one
0
|0