
Advertisement
- United States
- /
- Software
- /
- NasdaqGS:SPLK
A Look At The Intrinsic Value Of Splunk Inc. (NASDAQ:SPLK)
In this article we are going to estimate the intrinsic value of Splunk Inc. (NASDAQ:SPLK) by taking the expected future cash flows and discounting them to today's value. I will use the Discounted Cash Flow (DCF) model. Don't get put off by the jargon, the math behind it is actually quite straightforward.
We generally believe that a company's value is the present value of all of the cash it will generate in the future. However, a DCF is just one valuation metric among many, and it is not without flaws. Anyone interested in learning a bit more about intrinsic value should have a read of the Simply Wall St analysis model.
View our latest analysis for Splunk
The calculation
We are going to use a two-stage DCF model, which, as the name states, takes into account two stages of growth. The first stage is generally a higher growth period which levels off heading towards the terminal value, captured in the second 'steady growth' period. To start off with, we need to estimate the next ten years of cash flows. Where possible we use analyst estimates, but when these aren't available we extrapolate the previous free cash flow (FCF) from the last estimate or reported value. We assume companies with shrinking free cash flow will slow their rate of shrinkage, and that companies with growing free cash flow will see their growth rate slow, over this period. We do this to reflect that growth tends to slow more in the early years than it does in later years.
Generally we assume that a dollar today is more valuable than a dollar in the future, so we discount the value of these future cash flows to their estimated value in today's dollars:
10-year free cash flow (FCF) estimate
| 2020 | 2021 | 2022 | 2023 | 2024 | 2025 | 2026 | 2027 | 2028 | 2029 | |
| Levered FCF ($, Millions) | -US$383.2m | -US$293.2m | US$274.0m | US$925.0m | US$1.22b | US$1.44b | US$1.63b | US$1.79b | US$1.92b | US$2.03b |
| Growth Rate Estimate Source | Analyst x22 | Analyst x21 | Analyst x14 | Analyst x4 | Analyst x3 | Est @ 18.13% | Est @ 13.21% | Est @ 9.77% | Est @ 7.36% | Est @ 5.68% |
| Present Value ($, Millions) Discounted @ 7.9% | -US$355.0 | -US$251.6 | US$218 | US$681 | US$831 | US$909 | US$954 | US$970 | US$965 | US$944 |
("Est" = FCF growth rate estimated by Simply Wall St)
Present Value of 10-year Cash Flow (PVCF) = US$5.9b
We now need to calculate the Terminal Value, which accounts for all the future cash flows after this ten year period. For a number of reasons a very conservative growth rate is used that cannot exceed that of a country's GDP growth. In this case we have used the 10-year government bond rate (1.7%) to estimate future growth. In the same way as with the 10-year 'growth' period, we discount future cash flows to today's value, using a cost of equity of 7.9%.
Terminal Value (TV)= FCF2029 × (1 + g) ÷ (r – g) = US$2.0b× (1 + 1.7%) ÷ 7.9%– 1.7%) = US$33b
Present Value of Terminal Value (PVTV)= TV / (1 + r)10= US$33b÷ ( 1 + 7.9%)10= US$15b
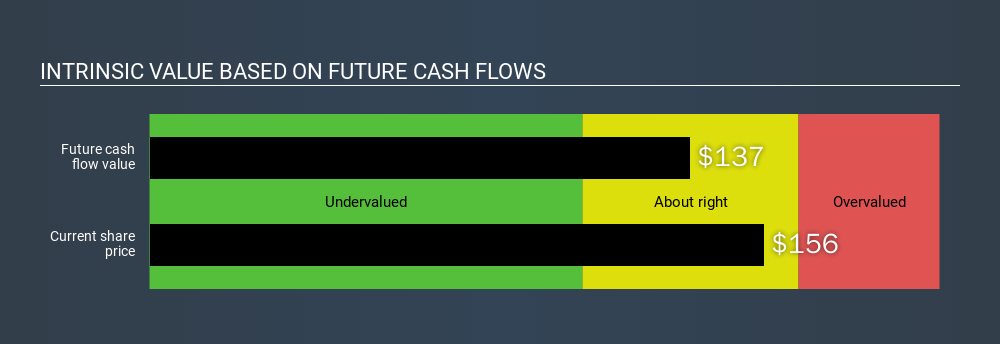
The total value, or equity value, is then the sum of the present value of the future cash flows, which in this case is US$21b. The last step is to then divide the equity value by the number of shares outstanding. Relative to the current share price of US$156, the company appears around fair value at the time of writing. Valuations are imprecise instruments though, rather like a telescope - move a few degrees and end up in a different galaxy. Do keep this in mind.
Important assumptions
The calculation above is very dependent on two assumptions. The first is the discount rate and the other is the cash flows. You don't have to agree with these inputs, I recommend redoing the calculations yourself and playing with them. The DCF also does not consider the possible cyclicality of an industry, or a company's future capital requirements, so it does not give a full picture of a company's potential performance. Given that we are looking at Splunk as potential shareholders, the cost of equity is used as the discount rate, rather than the cost of capital (or weighted average cost of capital, WACC) which accounts for debt. In this calculation we've used 7.9%, which is based on a levered beta of 1.140. Beta is a measure of a stock's volatility, compared to the market as a whole. We get our beta from the industry average beta of globally comparable companies, with an imposed limit between 0.8 and 2.0, which is a reasonable range for a stable business.
Next Steps:
Whilst important, DCF calculation shouldn’t be the only metric you look at when researching a company. The DCF model is not a perfect stock valuation tool. Rather it should be seen as a guide to "what assumptions need to be true for this stock to be under/overvalued?" If a company grows at a different rate, or if its cost of equity or risk free rate changes sharply, the output can look very different. For Splunk, I've compiled three additional aspects you should look at:
- Financial Health: Does SPLK have a healthy balance sheet? Take a look at our free balance sheet analysis with six simple checks on key factors like leverage and risk.
- Future Earnings: How does SPLK's growth rate compare to its peers and the wider market? Dig deeper into the analyst consensus number for the upcoming years by interacting with our free analyst growth expectation chart.
- Other High Quality Alternatives: Are there other high quality stocks you could be holding instead of SPLK? Explore our interactive list of high quality stocks to get an idea of what else is out there you may be missing!
PS. The Simply Wall St app conducts a discounted cash flow valuation for every stock on the NASDAQGS every day. If you want to find the calculation for other stocks just search here.
If you spot an error that warrants correction, please contact the editor at editorial-team@simplywallst.com. This article by Simply Wall St is general in nature. It does not constitute a recommendation to buy or sell any stock, and does not take account of your objectives, or your financial situation. Simply Wall St has no position in the stocks mentioned.
We aim to bring you long-term focused research analysis driven by fundamental data. Note that our analysis may not factor in the latest price-sensitive company announcements or qualitative material. Thank you for reading.
M

The Foxhole
When oil spikes, crude gets the attention. I think the boring refiner in the middle is where it gets interesting, and a record shows why.
67
 Andrew Legget
Market Insights
Great earnings season, but are the earnings real?

At first glance, this was the strongest earnings season in years. But when you look at where the growth actually came from, the story splits into two very different pictures.
85
About NasdaqGS:SPLK
Splunk
Splunk Inc., together with its subsidiaries, develops and markets cloud services and licensed software solutions in the United States and internationally.
Reasonable growth potential with adequate balance sheet.
Similar Companies
Market Insights


Advertisement
Weekly Picks
LO


Lou_Basenese on Oncolytics Biotech ·
The Team Behind a $2 Billion Johnson & Johnson (JNJ) Deal Just Took Over This $105 Million Cancer Biotech
Fair Value:US$3.574.9% undervalued
53 followersusers have followed this narrative
1 commentusers have commented on this narrative
12 likesusers have liked this narrative
AN


andrei9868 on ServiceNow ·
The Platform Turning Enterprise Chaos into Autonomous Workflows
Fair Value:US$17019.6% undervalued
34 followersusers have followed this narrative
2 commentsusers have commented on this narrative
6 likesusers have liked this narrative
JO


John_Eric on Vistra ·
Vistra Fell 38%. Adjusted EBITDA Rose 31%. Here's the $472 Million Reason They Disagree.
Fair Value:US$291.8750.8% undervalued
24 followersusers have followed this narrative
1 commentusers have commented on this narrative
12 likesusers have liked this narrative
HA


HarishPK on EverQuote ·
EverQuote and an Asymmetric Investment Opportunity
Fair Value:US$36.0931.2% undervalued
10 followersusers have followed this narrative
4 commentsusers have commented on this narrative
4 likesusers have liked this narrative
Recently Updated Narratives
RE

RecMag on Agfa-Gevaert ·
Agfa-Gevaert is a digital and materials turnaround opportunity, with growth potential in ZIRFON, but carrying legacy risks.
Fair Value:€5.3991.6% undervalued
28 followersusers have followed this narrative
0 commentsusers have commented on this narrative
0 likesusers have liked this narrative
RE

RecMag on Proximus ·
Proximus The Amplify Reset, State-Backed, Debt-Disciplined, and Building Toward €400M FCF by 2030
Fair Value:€821.6% undervalued
41 followersusers have followed this narrative
0 commentsusers have commented on this narrative
0 likesusers have liked this narrative
BR


Brunhilde_Wagner on A. O. Smith ·
Quick decision on China strategy needed
Fair Value:US$557.7% overvalued
1 followerusers have followed this narrative
0 commentsusers have commented on this narrative
0 likesusers have liked this narrative
Popular Narratives
OS


oscargarcia on NVIDIA ·
The company that went from selling GPUs to gamers to becoming the AI arms dealer of the 21st century.
Fair Value:US$28019.9% undervalued
375 followersusers have followed this narrative
9 commentsusers have commented on this narrative
17 likesusers have liked this narrative
JO

John_Eric on MercadoLibre ·
MercadoLibre and the Spreadsheet Trick That Decides Everything
Fair Value:US$7.31k72.6% undervalued
128 followersusers have followed this narrative
3 commentsusers have commented on this narrative
18 likesusers have liked this narrative
CU

CubanEros on Microsoft ·
A wonderful business at reasonable price.
Fair Value:US$419.9118.3% overvalued
219 followersusers have followed this narrative
0 commentsusers have commented on this narrative
9 likesusers have liked this narrative
Trending Discussion

BL


Blagget on BP Silver ·
Yes, it is for sure. When I first published my narrative on BP Silver back in January, it gave me strong Santacruz Silver vibes. But now I know this is the next SCZ.I'd like to ask you to take a look at Terra Balcanica (CSE:TERA).I'd be REALLY surprised if it doesn't interest you. I'd even challenge you to find a more undervalued miner than TERA. I'm serious. You'd earn a loyal follower and reader for the rest of my life.Let me point you to three stocks, without further context or explanation of how they're related, to quickly show how unreasonably low Terra Balcanica's market cap is. You'll obviously figure out the connection pretty quickly yourself.Military Metals - license revokedRegener8 Resources - zero-drill neighborAdriatic Metals - neighbor that DPM boughtI promise you, you can dig as deep as you want here, count in every negative aspect and even things that aren't negative but that someone might read as negative, and the current market cap still makes no sense. I strongly believe that will change rather soon though, judging by the level 2 market depth over the last couple of days.I also suggest you take a look at DPM documents/reports regarding Vareš. They seem pleased with the purchase? 😁Anyway, I agree on BP, 100% correct. Enjoyed the read.
1
|0