Advertisement
A Look At The Intrinsic Value Of Codan Limited (ASX:CDA)
In this article we are going to estimate the intrinsic value of Codan Limited (ASX:CDA) by estimating the company's future cash flows and discounting them to their present value. I will be using the Discounted Cash Flow (DCF) model. Don't get put off by the jargon, the math behind it is actually quite straightforward.
Companies can be valued in a lot of ways, so we would point out that a DCF is not perfect for every situation. If you want to learn more about discounted cash flow, the rationale behind this calculation can be read in detail in the Simply Wall St analysis model.
View our latest analysis for Codan
The model
We use what is known as a 2-stage model, which simply means we have two different periods of growth rates for the company's cash flows. Generally the first stage is higher growth, and the second stage is a lower growth phase. To start off with, we need to estimate the next ten years of cash flows. Where possible we use analyst estimates, but when these aren't available we extrapolate the previous free cash flow (FCF) from the last estimate or reported value. We assume companies with shrinking free cash flow will slow their rate of shrinkage, and that companies with growing free cash flow will see their growth rate slow, over this period. We do this to reflect that growth tends to slow more in the early years than it does in later years.
A DCF is all about the idea that a dollar in the future is less valuable than a dollar today, so we discount the value of these future cash flows to their estimated value in today's dollars:
10-year free cash flow (FCF) forecast
| 2020 | 2021 | 2022 | 2023 | 2024 | 2025 | 2026 | 2027 | 2028 | 2029 | |
| Levered FCF (A$, Millions) | AU$47.0m | AU$62.3m | AU$71.3m | AU$77.7m | AU$82.9m | AU$87.0m | AU$90.3m | AU$93.0m | AU$95.2m | AU$97.1m |
| Growth Rate Estimate Source | Analyst x2 | Analyst x2 | Analyst x1 | Est @ 9.01% | Est @ 6.63% | Est @ 4.96% | Est @ 3.8% | Est @ 2.98% | Est @ 2.41% | Est @ 2.01% |
| Present Value (A$, Millions) Discounted @ 7.1% | AU$43.9 | AU$54.4 | AU$58.1 | AU$59.2 | AU$58.9 | AU$57.8 | AU$56.0 | AU$53.9 | AU$51.6 | AU$49.2 |
("Est" = FCF growth rate estimated by Simply Wall St)
Present Value of 10-year Cash Flow (PVCF) = AU$542m
We now need to calculate the Terminal Value, which accounts for all the future cash flows after this ten year period. The Gordon Growth formula is used to calculate Terminal Value at a future annual growth rate equal to the 10-year government bond rate of 1.1%. We discount the terminal cash flows to today's value at a cost of equity of 7.1%.
Terminal Value (TV)= FCF2029 × (1 + g) ÷ (r – g) = AU$97m× (1 + 1.1%) ÷ 7.1%– 1.1%) = AU$1.6b
Present Value of Terminal Value (PVTV)= TV / (1 + r)10= AU$1.6b÷ ( 1 + 7.1%)10= AU$832m
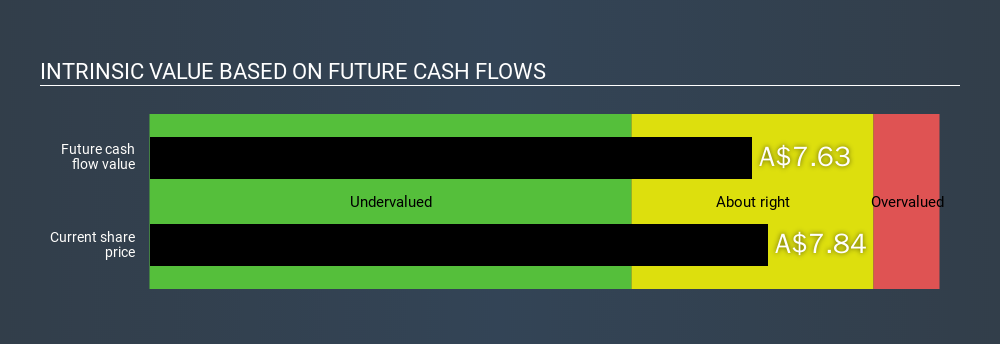
The total value, or equity value, is then the sum of the present value of the future cash flows, which in this case is AU$1.4b. To get the intrinsic value per share, we divide this by the total number of shares outstanding. Relative to the current share price of AU$7.8, the company appears around fair value at the time of writing. Remember though, that this is just an approximate valuation, and like any complex formula - garbage in, garbage out.
The assumptions
The calculation above is very dependent on two assumptions. The first is the discount rate and the other is the cash flows. You don't have to agree with these inputs, I recommend redoing the calculations yourself and playing with them. The DCF also does not consider the possible cyclicality of an industry, or a company's future capital requirements, so it does not give a full picture of a company's potential performance. Given that we are looking at Codan as potential shareholders, the cost of equity is used as the discount rate, rather than the cost of capital (or weighted average cost of capital, WACC) which accounts for debt. In this calculation we've used 7.1%, which is based on a levered beta of 1.097. Beta is a measure of a stock's volatility, compared to the market as a whole. We get our beta from the industry average beta of globally comparable companies, with an imposed limit between 0.8 and 2.0, which is a reasonable range for a stable business.
Next Steps:
Whilst important, DCF calculation shouldn’t be the only metric you look at when researching a company. The DCF model is not a perfect stock valuation tool. Rather it should be seen as a guide to "what assumptions need to be true for this stock to be under/overvalued?" If a company grows at a different rate, or if its cost of equity or risk free rate changes sharply, the output can look very different. For Codan, There are three relevant aspects you should further research:
- Future Earnings: How does CDA's growth rate compare to its peers and the wider market? Dig deeper into the analyst consensus number for the upcoming years by interacting with our free analyst growth expectation chart.
- Management:Have insiders been ramping up their shares to take advantage of the market's sentiment for CDA's future outlook? Check out our management and board analysis with insights on CEO compensation and governance factors.
- Other High Quality Alternatives: Are there other high quality stocks you could be holding instead of CDA? Explore our interactive list of high quality stocks to get an idea of what else is out there you may be missing!
PS. The Simply Wall St app conducts a discounted cash flow valuation for every stock on the ASX every day. If you want to find the calculation for other stocks just search here.
If you spot an error that warrants correction, please contact the editor at editorial-team@simplywallst.com. This article by Simply Wall St is general in nature. It does not constitute a recommendation to buy or sell any stock, and does not take account of your objectives, or your financial situation. Simply Wall St has no position in the stocks mentioned.
We aim to bring you long-term focused research analysis driven by fundamental data. Note that our analysis may not factor in the latest price-sensitive company announcements or qualitative material. Thank you for reading.
About ASX:CDA
Codan
Develops technology solutions for United Nations organizations, security and military agencies, government departments, corporates, individuals consumers, and small-scale miners.
Outstanding track record with excellent balance sheet.
Similar Companies
Market Insights


Advertisement
Weekly Picks
CE


Ceazar on Sparc AI ·
When GPS fails: this small cap is fixing a $54B drone problem
Fair Value:CA$5.2542.9% undervalued
64 followersusers have followed this narrative
0 commentsusers have commented on this narrative
17 likesusers have liked this narrative
HE


HedgeY on IonQ ·
The Best-Funded Quantum Platform and Still a Stock Priced for Perfection
Fair Value:US$487.1% overvalued
25 followersusers have followed this narrative
0 commentsusers have commented on this narrative
7 likesusers have liked this narrative
BL


BlackGoat on Cerebras Systems ·
The Wafer Giant Threatening NVIDIA's GPU Hegemony
Fair Value:US$415.5446.8% undervalued
44 followersusers have followed this narrative
1 commentusers have commented on this narrative
7 likesusers have liked this narrative
IV

Ivoed on Netflix ·
Netflix’s Business Quality Is Clear. The Harder Question Is Whether The Stock Is Still Cheap
Fair Value:US$829.5% undervalued
25 followersusers have followed this narrative
2 commentsusers have commented on this narrative
8 likesusers have liked this narrative
Recently Updated Narratives
BR

Bravosatya on Meta Platforms ·
Meta Platforms - Zuckerberg’s investment decisions are impulsive or Prudent?
Fair Value:US$730.0216.0% undervalued
3 followersusers have followed this narrative
0 commentsusers have commented on this narrative
0 likesusers have liked this narrative
JU

julio on FIGS ·
Figs valuation
Fair Value:US$14.3930.2% undervalued
21 followersusers have followed this narrative
6 commentsusers have commented on this narrative
0 likesusers have liked this narrative
AS


AstrisCorporateAdvisory on MIRAI ·
Improving NOI growth visibility on wider rent gap
Fair Value:JP¥77.06k45.8% undervalued
2 followersusers have followed this narrative
0 commentsusers have commented on this narrative
0 likesusers have liked this narrative
Popular Narratives
IN


Investingwilly on Mastercard ·
Mastercard: The Best Dividend Stock You're Ignoring
Fair Value:US$75030.3% undervalued
80 followersusers have followed this narrative
1 commentusers have commented on this narrative
9 likesusers have liked this narrative
HA


HarishPK on Adobe ·
Adobe: A Probabilistic Case for Undervaluation
Fair Value:US$319.9634.1% undervalued
62 followersusers have followed this narrative
9 commentsusers have commented on this narrative
19 likesusers have liked this narrative
MA


martinarauz on Nu Holdings ·
Investment Analysis (May 2026)
Fair Value:US$22.7441.1% undervalued
68 followersusers have followed this narrative
0 commentsusers have commented on this narrative
17 likesusers have liked this narrative
