Advertisement
- Denmark
- /
- Real Estate
- /
- CPSE:CEMAT
3 European Penny Stocks With Market Caps Under €40M

Simply Wall St
Reviewed by Simply Wall St

As European markets navigate a period of mixed returns, with the STOXX Europe 600 Index remaining relatively flat and inflation ticking up to the ECB's target, investors are seeking new opportunities in less conventional areas. Penny stocks, often associated with smaller or newer companies, continue to offer potential for growth when backed by strong financials. In this article, we explore three European penny stocks that stand out for their balance sheet strength and promise of long-term success.
Top 10 Penny Stocks In Europe
| Name | Share Price | Market Cap | Rewards & Risks |
| Maps (BIT:MAPS) | €3.44 | €45.69M | ✅ 4 ⚠️ 2 View Analysis > |
| Angler Gaming (NGM:ANGL) | SEK3.60 | SEK269.95M | ✅ 4 ⚠️ 2 View Analysis > |
| IAMBA Arad (BVB:FERO) | RON0.49 | RON17.25M | ✅ 2 ⚠️ 4 View Analysis > |
| Cellularline (BIT:CELL) | €2.83 | €59.69M | ✅ 4 ⚠️ 2 View Analysis > |
| Fondia Oyj (HLSE:FONDIA) | €4.72 | €17.65M | ✅ 2 ⚠️ 3 View Analysis > |
| Abak (WSE:ABK) | PLN4.30 | PLN11.59M | ✅ 2 ⚠️ 4 View Analysis > |
| Bredband2 i Skandinavien (OM:BRE2) | SEK2.495 | SEK2.39B | ✅ 4 ⚠️ 1 View Analysis > |
| Hifab Group (OM:HIFA B) | SEK3.66 | SEK222.67M | ✅ 2 ⚠️ 2 View Analysis > |
| Deceuninck (ENXTBR:DECB) | €2.09 | €288.55M | ✅ 3 ⚠️ 1 View Analysis > |
| Netgem (ENXTPA:ALNTG) | €0.984 | €33.18M | ✅ 3 ⚠️ 2 View Analysis > |
Click here to see the full list of 325 stocks from our European Penny Stocks screener.
Below we spotlight a couple of our favorites from our exclusive screener.
Cemat (CPSE:CEMAT)
Simply Wall St Financial Health Rating: ★★★★☆☆
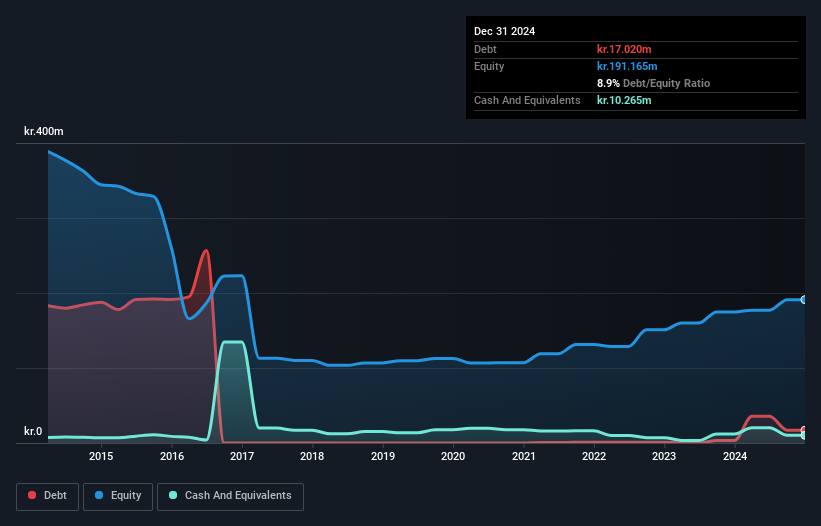
Overview: Cemat A/S develops, operates, and sells properties in Poland with a market cap of DKK234.67 million.
Operations: The company generates revenue primarily from Property Management & Holding, amounting to DKK39.37 million, with a minor contribution from Development at DKK0.024 million.
Market Cap: DKK234.67M
Cemat A/S, with a market cap of DKK234.67 million, primarily generates revenue from its property management operations in Poland. Despite being profitable over the past five years with earnings growth of 15.3% annually, recent results were significantly influenced by a DKK12 million one-off gain. The company's net profit margin improved slightly to 31%, supported by well-covered interest payments and satisfactory debt levels at 3.5% net debt to equity ratio. However, negative operating cash flow raises concerns about debt coverage through cash generation. Cemat's experienced management team and board provide stability amidst these financial dynamics.
- Jump into the full analysis health report here for a deeper understanding of Cemat.
- Gain insights into Cemat's past trends and performance with our report on the company's historical track record.
NX Filtration (ENXTAM:NXFIL)
Simply Wall St Financial Health Rating: ★★★★★☆
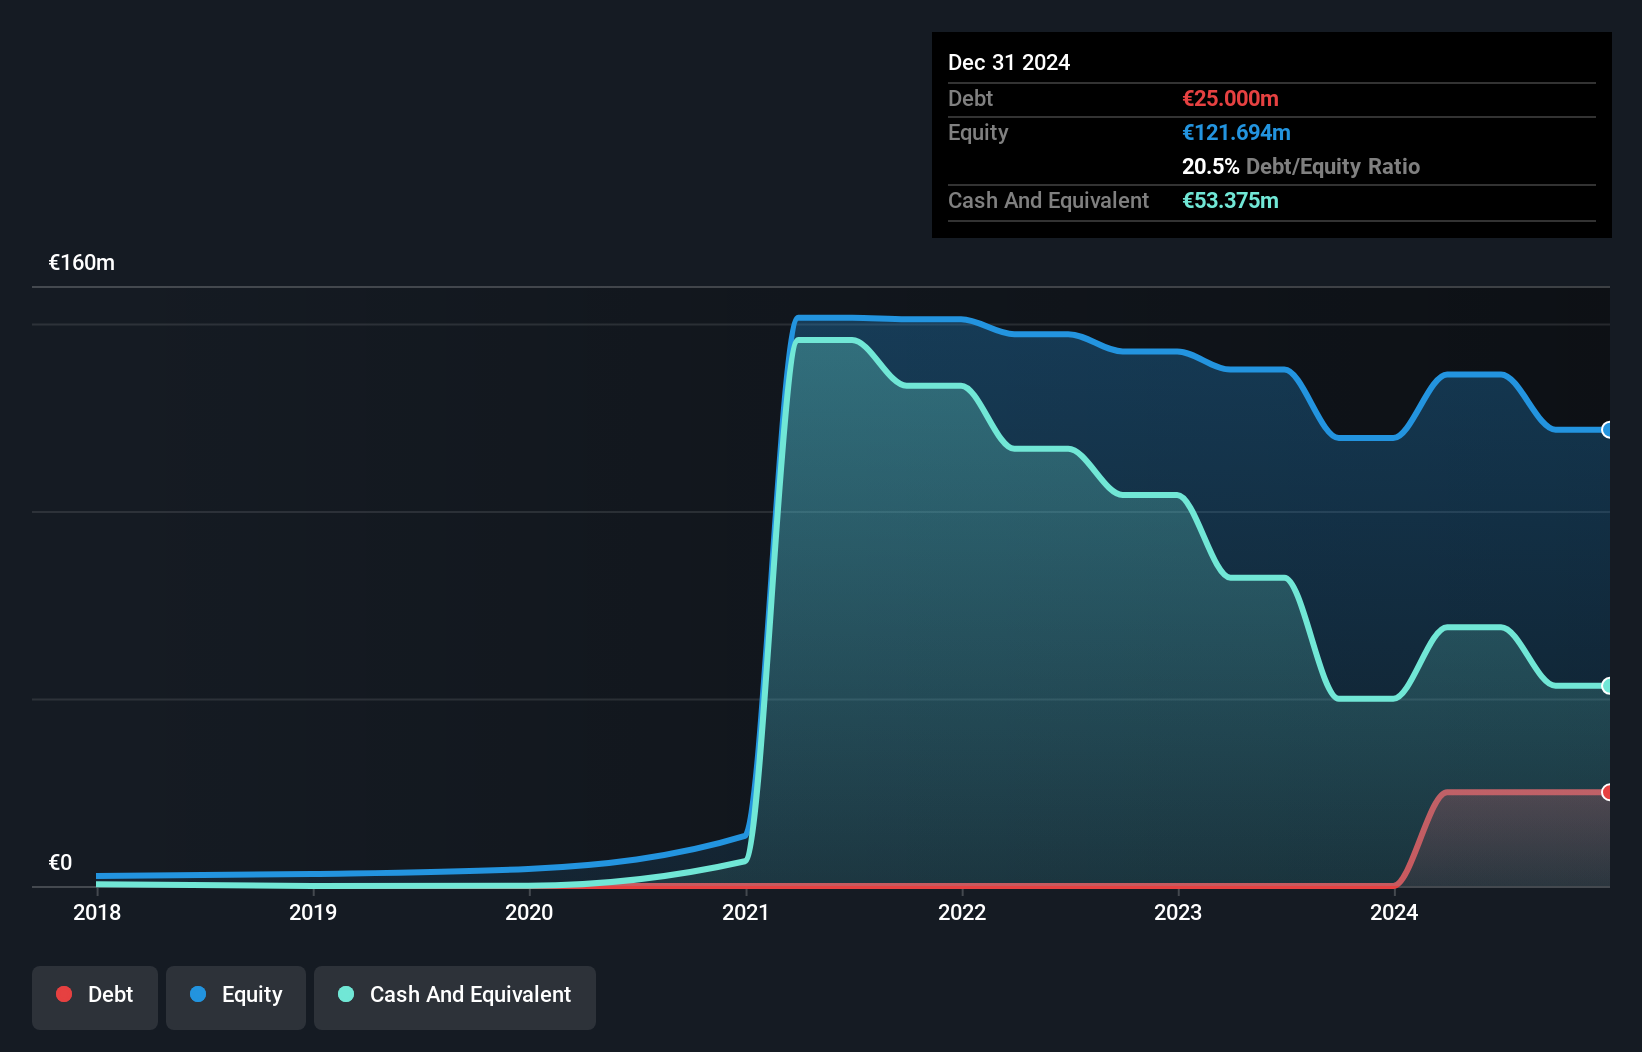
Overview: NX Filtration N.V. is a company that develops, produces, and sells hollow fiber membrane modules globally, with a market cap of €211.32 million.
Operations: The company's revenue is divided into two segments: Clean Municipal Water, generating €3.72 million, and Sustainable Industrial Water, contributing €6.36 million.
Market Cap: €211.32M
NX Filtration N.V., with a market cap of €211.32 million, has shown revenue growth from €8.05 million to €11.08 million year-over-year, though it remains unprofitable with a net loss of €23.09 million in 2024. The company's short-term assets (€77M) comfortably cover both short-term (€9.3M) and long-term liabilities (€25.3M). Despite an increased debt-to-equity ratio from 0% to 20.5%, it holds more cash than total debt, ensuring a sufficient cash runway for over three years if historical free cash flow reductions continue at 41% annually, although profitability is not expected in the near term.
- Get an in-depth perspective on NX Filtration's performance by reading our balance sheet health report here.
- Gain insights into NX Filtration's outlook and expected performance with our report on the company's earnings estimates.
Ocean Sun (OB:OSUN)
Simply Wall St Financial Health Rating: ★★★★★★
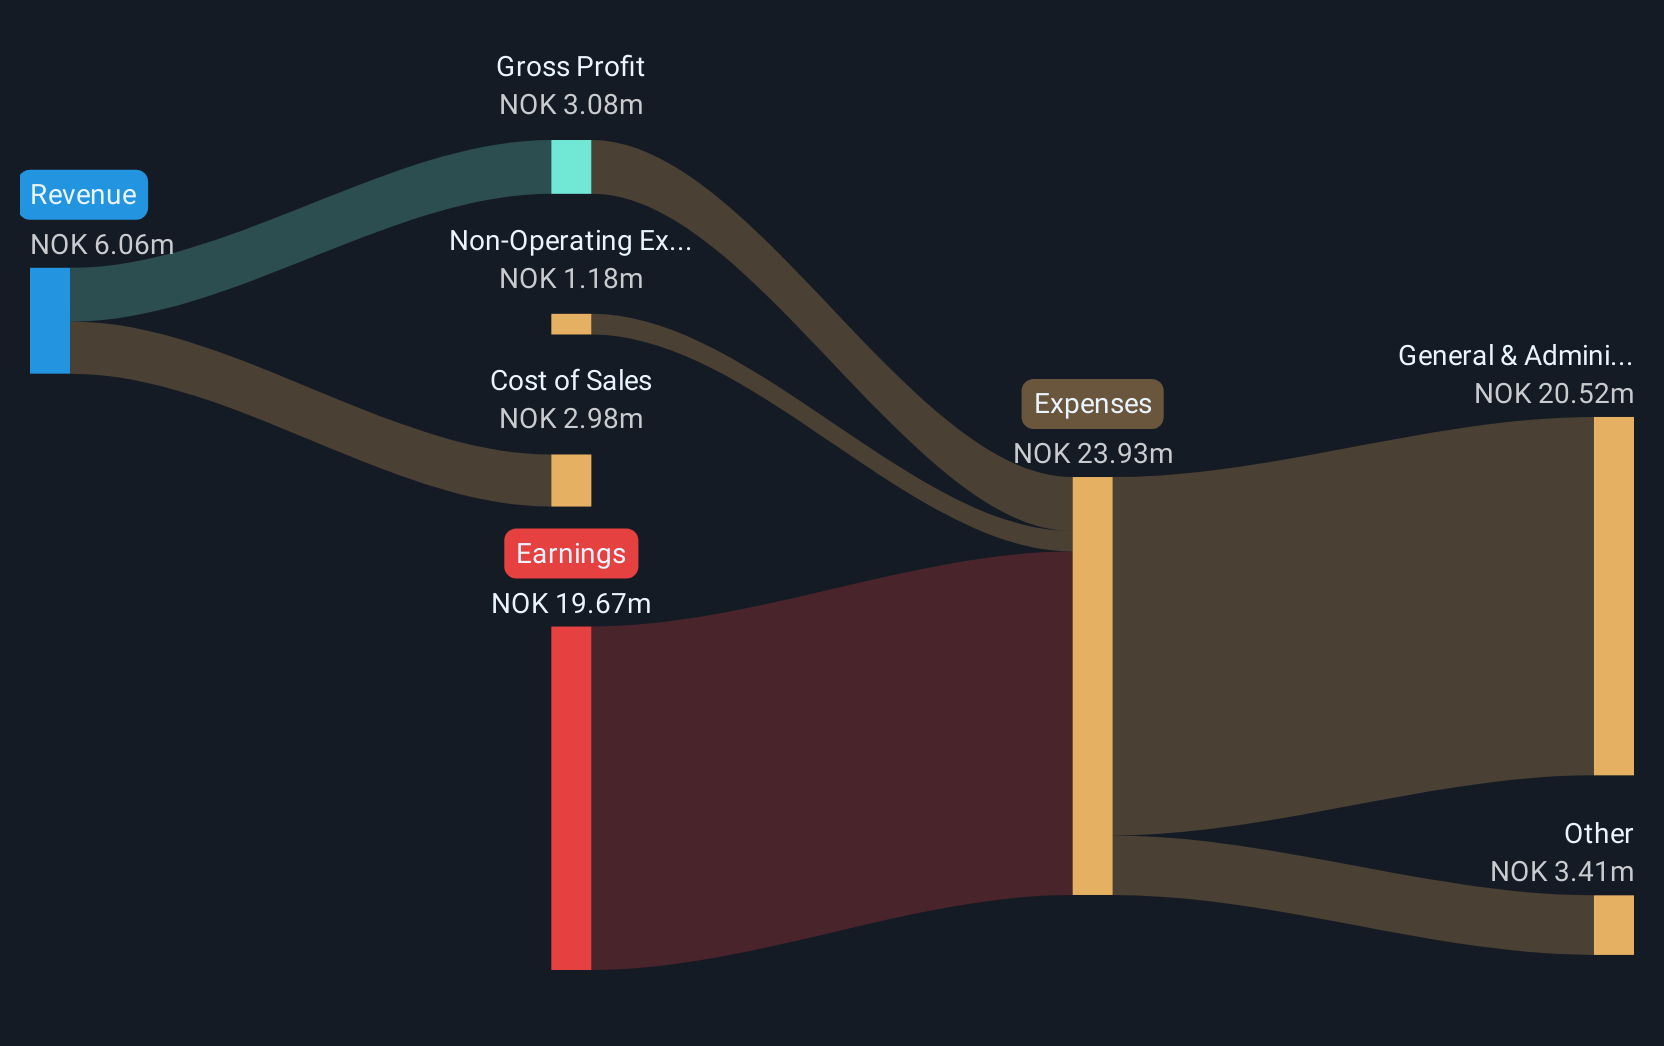
Overview: Ocean Sun AS develops floating power systems with solar panels and has a market cap of NOK62.49 million.
Operations: The company does not report specific revenue segments.
Market Cap: NOK62.49M
Ocean Sun AS, with a market cap of NOK62.49 million, operates in the renewable energy sector and remains pre-revenue, reporting NOK1.45 million for Q1 2025. The company is currently unprofitable with increasing losses over five years at 4.5% annually and a recent net loss of NOK5.18 million for Q1 2025 compared to NOK2.48 million the previous year. Despite its financial challenges, Ocean Sun benefits from being debt-free and having sufficient short-term assets (NOK31.6M) to cover liabilities (NOK8.4M). However, high share price volatility persists alongside an inexperienced management team averaging 0.8 years tenure.
- Take a closer look at Ocean Sun's potential here in our financial health report.
- Learn about Ocean Sun's historical performance here.
Seize The Opportunity
- Explore the 325 names from our European Penny Stocks screener here.
- Curious About Other Options? We've found 16 US stocks that are forecast to pay a dividend yeild of over 6% next year. See the full list for free.
This article by Simply Wall St is general in nature. We provide commentary based on historical data and analyst forecasts only using an unbiased methodology and our articles are not intended to be financial advice. It does not constitute a recommendation to buy or sell any stock, and does not take account of your objectives, or your financial situation. We aim to bring you long-term focused analysis driven by fundamental data. Note that our analysis may not factor in the latest price-sensitive company announcements or qualitative material. Simply Wall St has no position in any stocks mentioned.
New: AI Stock Screener & Alerts
Our new AI Stock Screener scans the market every day to uncover opportunities.
• Dividend Powerhouses (3%+ Yield)
• Undervalued Small Caps with Insider Buying
• High growth Tech and AI Companies
Or build your own from over 50 metrics.
Have feedback on this article? Concerned about the content? Get in touch with us directly. Alternatively, email editorial-team@simplywallst.com
About CPSE:CEMAT
Adequate balance sheet with acceptable track record.
Market Insights


Advertisement
Community Narratives
For the Emperor: Why Games Workshop Could Be a Star Investment
Fair Value UK£160.00|0.4% overvalued
RO
Community Contributor
Securitas will boost margins with AI and tech-driven services
Fair Value SEK 260.91|44.5% undervalued
UN
Community Contributor
A Leader in EV Charging with Growth Potential
Fair Value €27.00|17.8% undervalued
TI
Community Contributor