- Denmark
- /
- Real Estate
- /
- CPSE:CEMAT
3 European Penny Stocks With Market Caps Under €70M

Reviewed by Simply Wall St

Amid easing tariff concerns, European markets have shown resilience, with the STOXX Europe 600 Index rising by 3.44% and major indices across Germany, Italy, France, and the UK posting solid gains. This positive momentum in the broader market sets a fertile ground for exploring investment opportunities in smaller-cap segments. While "penny stocks" might sound outdated, they continue to offer intriguing possibilities for investors seeking growth potential in emerging or smaller companies that demonstrate strong financial health.
Top 10 Penny Stocks In Europe
| Name | Share Price | Market Cap | Rewards & Risks |
| Transferator (NGM:TRAN A) | SEK2.68 | SEK252.93M | ✅ 2 ⚠️ 3 View Analysis > |
| Angler Gaming (NGM:ANGL) | SEK3.84 | SEK287.94M | ✅ 4 ⚠️ 3 View Analysis > |
| Hifab Group (OM:HIFA B) | SEK3.50 | SEK212.94M | ✅ 2 ⚠️ 2 View Analysis > |
| IMS (WSE:IMS) | PLN3.71 | PLN125.75M | ✅ 4 ⚠️ 2 View Analysis > |
| FAE Technology (BIT:FAE) | €2.47 | €49.46M | ✅ 4 ⚠️ 3 View Analysis > |
| Cellularline (BIT:CELL) | €2.54 | €53.57M | ✅ 4 ⚠️ 2 View Analysis > |
| Netgem (ENXTPA:ALNTG) | €0.9651 | €32.32M | ✅ 3 ⚠️ 2 View Analysis > |
| Arcure (ENXTPA:ALCUR) | €4.1005 | €23.74M | ✅ 3 ⚠️ 3 View Analysis > |
| Fondia Oyj (HLSE:FONDIA) | €4.64 | €17.35M | ✅ 2 ⚠️ 3 View Analysis > |
| Deceuninck (ENXTBR:DECB) | €2.205 | €304.43M | ✅ 3 ⚠️ 1 View Analysis > |
Click here to see the full list of 435 stocks from our European Penny Stocks screener.
Underneath we present a selection of stocks filtered out by our screen.
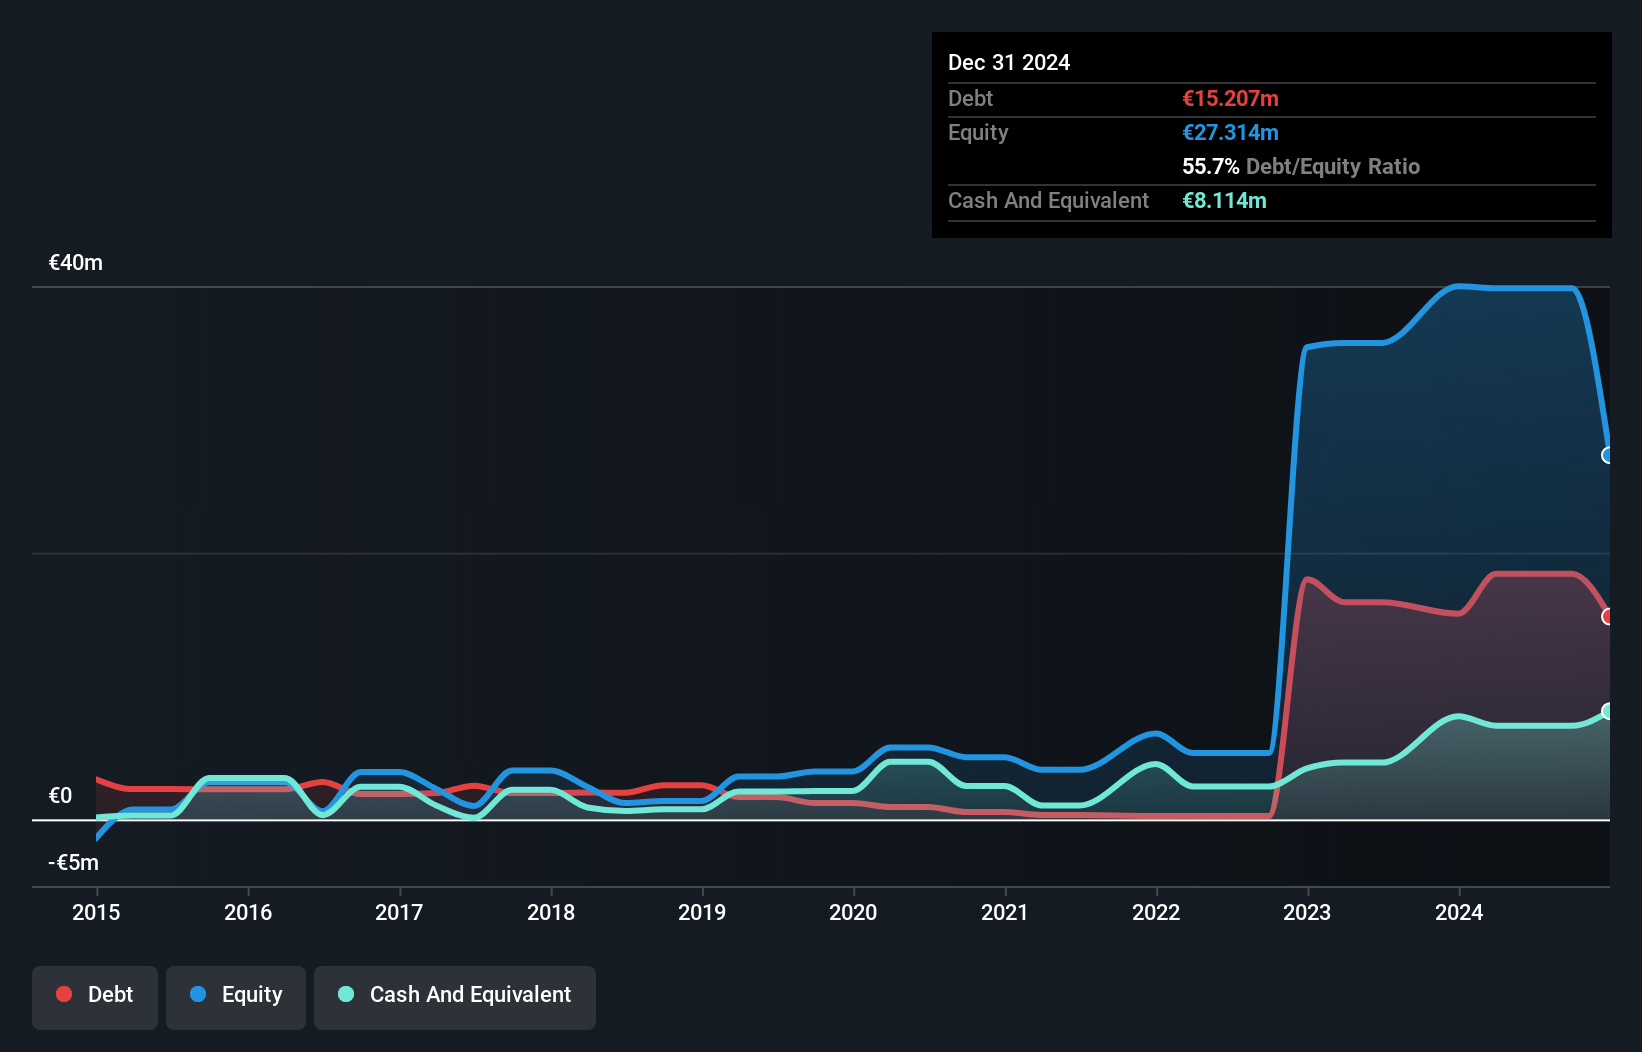
Cemat (CPSE:CEMAT)
Simply Wall St Financial Health Rating: ★★★★☆☆
Overview: Cemat A/S is involved in the development, operation, and sale of properties in Poland and has a market cap of DKK247.30 million.
Operations: Cemat's revenue is primarily generated from Property Management & Holding, which accounts for DKK39.37 million, with a smaller contribution from Development at DKK0.024 million.
Market Cap: DKK247.3M
Cemat A/S, with a market cap of DKK247.30 million, has shown stable growth in earnings over the past five years at 15.3% annually, although its Return on Equity remains low at 7%. The company recently secured zoning approval for a residential development in Warsaw's Bielany district, significantly increasing the property's fair value to PLN 13.07 million from PLN 2.99 million previously. Despite positive earnings growth and an experienced management team, Cemat's operating cash flow is negative and debt coverage is inadequate. Short-term assets comfortably exceed liabilities, offering some financial stability amidst these challenges.
- Get an in-depth perspective on Cemat's performance by reading our balance sheet health report here.
- Assess Cemat's previous results with our detailed historical performance reports.

Vincit Oyj (HLSE:VINCIT)
Simply Wall St Financial Health Rating: ★★★★★☆
Overview: Vincit Oyj offers service design and software development services across Finland, Poland, Portugal, Sweden, and the United States with a market cap of €28.71 million.
Operations: Vincit Oyj has not reported any specific revenue segments.
Market Cap: €28.71M
Vincit Oyj, with a market cap of €28.71 million, is trading at 56.8% below its estimated fair value, indicating potential undervaluation in the penny stock segment. Despite this, the company remains unprofitable with increasing losses over the past five years and a negative Return on Equity of -17.36%. Its short-term assets (€28.6M) exceed both short-term (€19.6M) and long-term liabilities (€745K), providing some financial cushion. Recent earnings reports show declining sales and increased net losses year-on-year, highlighting ongoing challenges in achieving profitability despite an experienced management team and board of directors.
- Dive into the specifics of Vincit Oyj here with our thorough balance sheet health report.
- Examine Vincit Oyj's earnings growth report to understand how analysts expect it to perform.

Meriaura Group Oyj (OM:MERIS)
Simply Wall St Financial Health Rating: ★★★★☆☆
Overview: Meriaura Group Oyj, with a market cap of SEK754.12 million, designs and delivers solar thermal systems in Europe and internationally through its subsidiaries.
Operations: The company generates revenue from its Building Materials segment, specifically through HVAC Equipment, amounting to €79.16 million.
Market Cap: SEK754.12M
Meriaura Group Oyj, with a market cap of SEK754.12 million, operates in the solar thermal systems sector and has shown volatility typical of penny stocks. Despite generating €79.16 million in revenue from its Building Materials segment, it remains unprofitable with a net loss of €20.69 million last year and a negative Return on Equity of -75.32%. The company’s short-term assets (€19.7M) exceed its liabilities, providing some financial stability amidst increased debt levels over five years. Recent board changes and merger discussions with Summa Defence Oy may impact future strategic direction and operational focus.
- Click here and access our complete financial health analysis report to understand the dynamics of Meriaura Group Oyj.
- Explore Meriaura Group Oyj's analyst forecasts in our growth report.
Seize The Opportunity
- Reveal the 435 hidden gems among our European Penny Stocks screener with a single click here.
- Ready To Venture Into Other Investment Styles? This technology could replace computers: discover the 22 stocks are working to make quantum computing a reality.
This article by Simply Wall St is general in nature. We provide commentary based on historical data and analyst forecasts only using an unbiased methodology and our articles are not intended to be financial advice. It does not constitute a recommendation to buy or sell any stock, and does not take account of your objectives, or your financial situation. We aim to bring you long-term focused analysis driven by fundamental data. Note that our analysis may not factor in the latest price-sensitive company announcements or qualitative material. Simply Wall St has no position in any stocks mentioned.
New: AI Stock Screener & Alerts
Our new AI Stock Screener scans the market every day to uncover opportunities.
• Dividend Powerhouses (3%+ Yield)
• Undervalued Small Caps with Insider Buying
• High growth Tech and AI Companies
Or build your own from over 50 metrics.
Have feedback on this article? Concerned about the content? Get in touch with us directly. Alternatively, email editorial-team@simplywallst.com
About CPSE:CEMAT
Adequate balance sheet with acceptable track record.
Market Insights

Community Narratives

