Narratives are currently in beta
Key Takeaways
- Synchrony's focus on risk-adjusted returns and credit actions may limit account generation and purchase volumes, impacting revenue growth.
- Regulatory changes and consumer adjustments may compress net margins, affecting profitability due to potential declines in fee income and increased RSA provisions.
- Synchrony's strategic partnerships, innovative customer experiences, disciplined cost management, and data-driven digital enhancements could drive long-term growth and profitability amid economic challenges.
Catalysts
About Synchrony Financial- Operates as a consumer financial services company in the United States.
- Despite already taking actions to reinforce the credit trajectory, Synchrony faces a potential decline in purchase volumes due to expected consumer behavior shifts and their own strategy adjustments. This could negatively impact future revenue growth.
- The company's focus on maintaining risk-adjusted returns through credit actions may result in near-term pressure on new account generation and purchase volumes, potentially affecting future revenue and earnings growth.
- Synchrony’s implementation of product, pricing, and policy changes (PPPCs) is intended to offset future regulatory impacts but could also impact customer spend behavior and overall net margins.
- The anticipated rule changes regarding late fees present significant uncertainty, which could affect Synchrony's earnings if new rules lead to decreased fee income and increased provision for risk sharing agreements (RSAs).
- A decrease in high-margin fees due to proactive consumer adjustments, like increased e-bill enrollment, may compress net margins, impacting Synchrony’s future profitability.
Synchrony Financial Future Earnings and Revenue Growth
Assumptions
How have these above catalysts been quantified?- Analysts are assuming Synchrony Financial's revenue will grow by 22.4% annually over the next 3 years.
- Analysts assume that profit margins will shrink from 34.5% today to 16.3% in 3 years time.
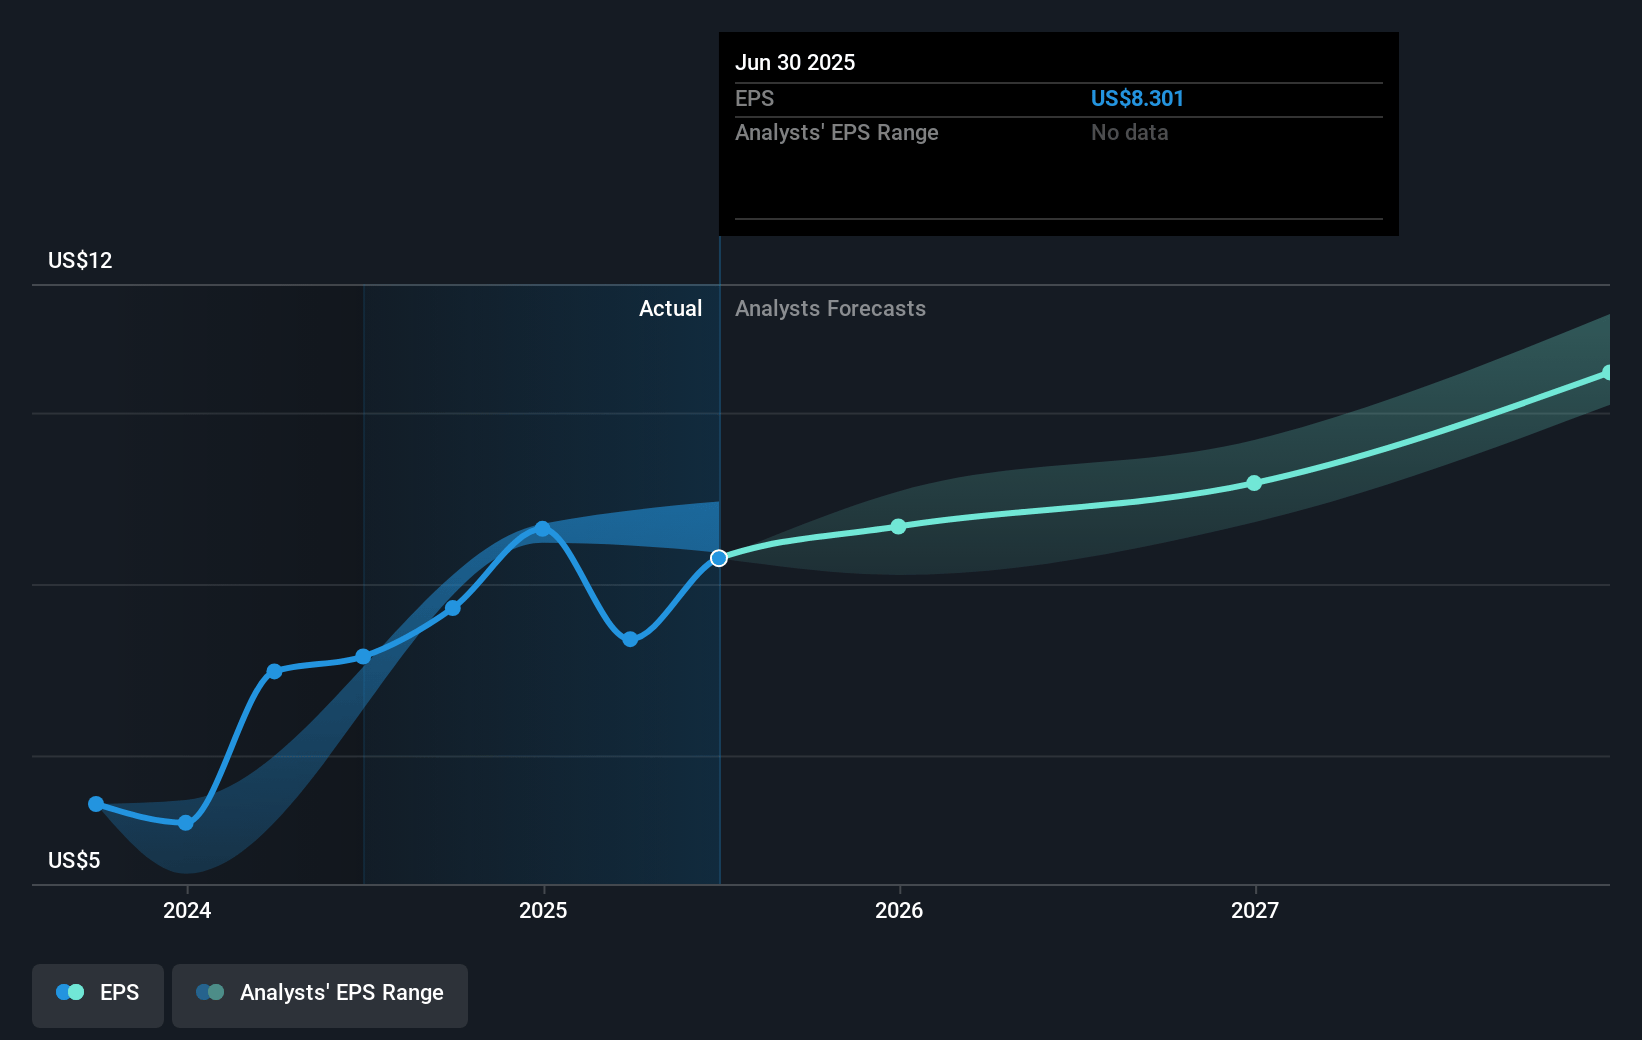
- Analysts expect earnings to reach $2.7 billion (and earnings per share of $6.82) by about December 2027, down from $3.1 billion today. However, there is some disagreement amongst the analysts with the more bullish ones expecting earnings as high as $4.3 billion.
- In order for the above numbers to justify the analysts price target, the company would need to trade at a PE ratio of 12.6x on those 2027 earnings, up from 8.4x today. This future PE is greater than the current PE for the US Consumer Finance industry at 11.7x.
- Analysts expect the number of shares outstanding to grow by 0.61% per year for the next 3 years.
- To value all of this in today's terms, we will use a discount rate of 8.08%, as per the Simply Wall St company report.
Synchrony Financial Future Earnings Per Share Growth
Risks
What could happen that would invalidate this narrative?- Synchrony's robust partnership strategy, which includes renewing and forming strategic alliances with significant retail and service brands like DICK's Sporting Goods, Gibson, and Albertsons, could enhance customer engagement and drive revenue growth over time.
- The company's focus on delivering innovative and seamless customer experiences, such as the new pet insurance reimbursement model, may strengthen customer loyalty and support revenue, potentially buffering against broader economic challenges.
- The ability of Synchrony to maintain strong risk-adjusted returns through credit actions and policy adjustments, as evidenced by the management's confidence in their strategic outlook, may support stable earnings in the face of potential economic headwinds.
- Synchrony's positive financial indicators, such as increased net revenues and disciplined cost management resulting in favorable efficiency ratios, indicate strong operational performance that could maintain or enhance net margins.
- The strategic moves to leverage proprietary data analytics for customer interaction and the enhancement of digital capabilities signal potential for long-term growth and sustained profitability as consumer behavior evolves.
Valuation
How have all the factors above been brought together to estimate a fair value?- The analysts have a consensus price target of $68.34 for Synchrony Financial based on their expectations of its future earnings growth, profit margins and other risk factors. However, there is a degree of disagreement amongst analysts, with the most bullish reporting a price target of $85.0, and the most bearish reporting a price target of just $40.0.
- In order for you to agree with the analyst's consensus, you'd need to believe that by 2027, revenues will be $16.5 billion, earnings will come to $2.7 billion, and it would be trading on a PE ratio of 12.6x, assuming you use a discount rate of 8.1%.
- Given the current share price of $67.19, the analyst's price target of $68.34 is 1.7% higher. The relatively low difference between the current share price and the analyst consensus price target indicates that they believe on average, the company is fairly priced.
- We always encourage you to reach your own conclusions though. So sense check these analyst numbers against your own assumptions and expectations based on your understanding of the business and what you believe is probable.
How well do narratives help inform your perspective?
Disclaimer
Warren A.I. is a tool utilizing a Large Language Model (LLM) that ingests data on consensus price targets, forecasted revenue and earnings figures, as well as the transcripts of earnings calls to produce qualitative analysis. The narratives produced by Warren A.I. are general in nature and are based solely on analyst data and publicly-available material published by the respective companies. These scenarios are not indicative of the company's future performance and are exploratory in nature. Simply Wall St has no position in the company(s) mentioned. The price targets and estimates used are consensus data, and do not constitute a recommendation to buy or sell any stock, and they do not take account of your objectives, or your financial situation. Note that Warren A.I.'s analysis may not factor in the latest price-sensitive company announcements or qualitative material.
Read more narratives
There are no other narratives for this company.
View all narratives


