


Last Update 06 Dec 25
Fair value Decreased 4.14%REVG: Terex Merger Dynamics Will Shape Future Risk Reward Profile
Analysts have trimmed their price target on REV Group to $55 from $64, reflecting a slightly lower fair value estimate of about $60 per share as they weigh modestly softer growth and margin assumptions, along with heightened deal risk from the Terex merger.
Analyst Commentary
Recent revisions to estimates and price targets highlight a more balanced risk reward profile for REV Group as it pursues the Terex transaction and integrates aerials into its broader platform.
Analysts acknowledge that execution on the merger, and the quality of earnings from the combined business, will be key drivers of whether the stock can justify a mid to high 50s fair value over the next 12 to 18 months.
Bullish Takeaways
- Bullish analysts view the Terex merger as offering good strategic value, potentially enhancing REV Group's scale and positioning in specialty vehicles and aerials, which could support a higher long term earnings power.
- Model updates following recent earnings have driven higher outer year EPS forecasts, suggesting underlying demand and operational improvements remain intact despite the trimmed near term price target.
- The revised target still implies upside from current levels in many scenarios, assuming successful integration and realization of expected cost and revenue synergies.
- Stronger visibility into FY25 and beyond, supported by an expanding backlog and disciplined capital allocation, is seen as supportive of a premium to historical valuation multiples if execution remains solid.
Bearish Takeaways
- Bearish analysts emphasize elevated deal risk around the timing, structure, and valuation of the Terex merger, which could introduce volatility and constrain multiple expansion in the near term.
- Concerns around potential dilution from the transaction and uncertainty over the true underlying value of the combined aerials platform may limit investor appetite until clearer financial metrics are available.
- Any slippage in integration milestones or weaker than expected margins from the acquired business could challenge current EPS forecasts and justify a lower fair value range.
- With the rating anchored at a neutral stance, some analysts see a more balanced risk profile and argue that the shares could be vulnerable if macro conditions soften or if synergy delivery falls short of expectations.
What's in the News
- Morgan Stanley lowered its price target on REV Group to $55 from $64, maintaining an Equal Weight rating and citing both strategic value and elevated deal risk tied to the Terex merger (Morgan Stanley research note, Periodicals).
- Terex Corporation agreed to acquire REV Group for $3.2 billion in a stock and cash transaction, with REV shareholders to receive 0.9809 shares of the combined company plus $8.71 in cash per REV share, and the combined company to trade under the TEX ticker (M&A Transaction Announcements, Key Developments).
- Post close, Terex shareholders are expected to own about 58 percent and REV Group shareholders about 42 percent of the combined company on a fully diluted basis, with a 12 member board comprising seven Terex and five REV directors (M&A Transaction Announcements, Key Developments).
- The merger has been unanimously approved by both boards and is expected to close in the first half of 2026, subject to shareholder approvals, regulatory clearances, and customary conditions, with a $128 million capped termination fee applicable under specified scenarios (M&A Transaction Announcements, Key Developments).
- REV Recreational Vehicles Segment reported strong demand at major industry shows, debuting new Renegade RV models and nearly doubling unit sales at the Hershey event compared to 2024 (Product Related Announcements, Key Developments).
Valuation Changes
- Fair Value: Trimmed modestly from about $62.80 to $60.20 per share, reflecting slightly softer long term assumptions.
- Discount Rate: Risen marginally from roughly 8.35 percent to 8.37 percent, implying a slightly higher required return on capital.
- Revenue Growth: Eased slightly from about 6.33 percent to 6.32 percent, indicating a small downward revision to top line expectations.
- Net Profit Margin: Reduced modestly from approximately 7.49 percent to 7.47 percent, pointing to a minor downgrade in profitability forecasts.
- Future P/E: Lowered from about 14.8x to 14.2x, suggesting a somewhat more conservative valuation multiple on forward earnings.
Key Takeaways
- Streamlined operations and investments in production efficiency, technology, and electrification position the company for improved margins and growth amid rising specialty vehicle demand.
- A robust order backlog and targeted divestitures provide earnings stability and capital for expansion, insulating against economic uncertainties and supporting future profitability.
- Narrowed market focus heightens vulnerability to downturns, while persistent cost pressures and rising competition threaten margins and future revenue growth.
Catalysts
About REV Group- Designs, manufactures, and distributes specialty vehicles, and related aftermarket parts and services in North America and internationally.
- Continued operational investments-such as the Spartan Emergency Response facility expansion-enhance production capacity and efficiency, positioning REV Group to capitalize on sustained municipal demand for fire and emergency vehicles as aging fleets require replacement, supporting long-term revenue growth and scale-driven margin improvements.
- Elevated focus on manufacturing throughput and process innovation enables REV Group to reduce lead times and cycle times, providing a competitive edge to capture consistent government and institutional orders, especially as urbanization and municipal infrastructure investments underpin a secular increase in specialty vehicle demand, positively impacting both revenue visibility and net margins.
- A strategically large, multi-year backlog in the fire and ambulance divisions provides earnings protection while allowing pricing actions and favorable product mix to be realized over time, buffering against near-term economic uncertainty and driving steady earnings and margin expansion.
- Accelerated divestitures of non-core businesses and reinvestment into higher-margin segments not only streamline operations but also unlock operating leverage and free up capital for targeted growth initiatives-improving future net margins and cash flow generation.
- Early-cycle, scalable investments in technology and green solutions (including upcoming expansions in EV production and partnerships for electrification) are set to benefit from the impending transition of public transit and emergency services toward electrified fleets, aligning with policy-driven demand and paving the way for incremental revenue growth and improved long-term earnings quality.
REV Group Future Earnings and Revenue Growth
Assumptions
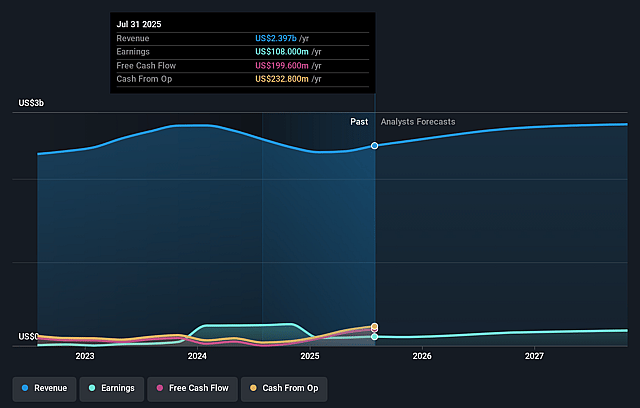
How have these above catalysts been quantified?- Analysts are assuming REV Group's revenue will grow by 6.0% annually over the next 3 years.
- Analysts assume that profit margins will increase from 4.5% today to 7.6% in 3 years time.
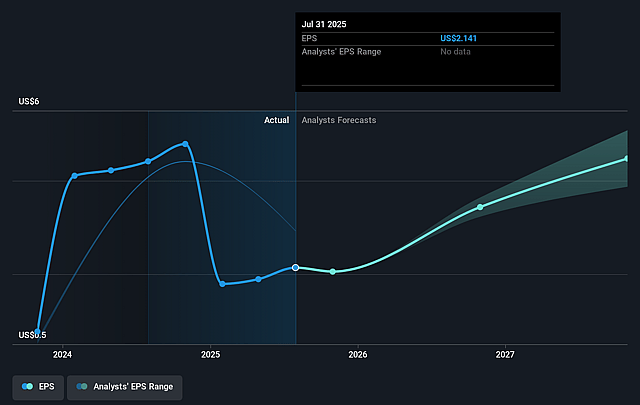
- Analysts expect earnings to reach $218.0 million (and earnings per share of $5.33) by about September 2028, up from $108.0 million today.
- In order for the above numbers to justify the analysts price target, the company would need to trade at a PE ratio of 15.2x on those 2028 earnings, down from 28.1x today. This future PE is lower than the current PE for the US Machinery industry at 24.7x.
- Analysts expect the number of shares outstanding to decline by 6.15% per year for the next 3 years.
- To value all of this in today's terms, we will use a discount rate of 7.99%, as per the Simply Wall St company report.
REV Group Future Earnings Per Share Growth
Risks
What could happen that would invalidate this narrative?- Continued exposure to inflationary pressures and new tariffs (notably $20 million annual headwind expected to persist into fiscal 2026) could become permanent additions to the cost base, limiting REV Group's ability to expand net margins if productivity gains or future price increases fail to sufficiently offset these incremental expenses.
- The divestiture of the ENC transit bus business and Lance Camper narrows the company's end-market exposure, reducing diversification and potentially making revenues more dependent on a smaller set of sectors (fire, ambulance, and motorized RVs), which increases vulnerability to cyclical downturns or funding disruptions in these core markets.
- Persistent softness and macroeconomic uncertainty in the Recreational Vehicles segment, including dealer destocking and declining backlogs, highlight the risk that discretionary demand for motorized RVs may remain depressed, impacting revenue growth and EBITDA generation in this segment over the long term.
- Progress in reducing Specialty Vehicles backlog and delivery times-while currently advantageous-signals that the exceptional demand and extended lead times supporting recent financial performance may be normalizing, posing a risk that revenue and order intake could slow as the market absorbs prior excess demand.
- Increasing industry-wide efficiency, capacity expansions (including at competitors), and the threat of greater price competition as order books normalize could exert downward pressure on prices and erode REV Group's competitive advantage, ultimately impacting future revenue growth and profit margins as market dynamics evolve.
Valuation
How have all the factors above been brought together to estimate a fair value?- The analysts have a consensus price target of $65.75 for REV Group based on their expectations of its future earnings growth, profit margins and other risk factors.
- In order for you to agree with the analyst's consensus, you'd need to believe that by 2028, revenues will be $2.9 billion, earnings will come to $218.0 million, and it would be trading on a PE ratio of 15.2x, assuming you use a discount rate of 8.0%.
- Given the current share price of $62.16, the analyst price target of $65.75 is 5.5% higher. The relatively low difference between the current share price and the analyst consensus price target indicates that they believe on average, the company is fairly priced.
- We always encourage you to reach your own conclusions though. So sense check these analyst numbers against your own assumptions and expectations based on your understanding of the business and what you believe is probable.
Have other thoughts on REV Group?
Create your own narrative on this stock, and estimate its Fair Value using our Valuator tool.
Create NarrativeHow well do narratives help inform your perspective?
Disclaimer
AnalystConsensusTarget is a tool utilizing a Large Language Model (LLM) that ingests data on consensus price targets, forecasted revenue and earnings figures, as well as the transcripts of earnings calls to produce qualitative analysis. The narratives produced by AnalystConsensusTarget are general in nature and are based solely on analyst data and publicly-available material published by the respective companies. These scenarios are not indicative of the company's future performance and are exploratory in nature. Simply Wall St has no position in the company(s) mentioned. Simply Wall St may provide the securities issuer or related entities with website advertising services for a fee, on an arm's length basis. These relationships have no impact on the way we conduct our business, the content we host, or how our content is served to users. The price targets and estimates used are consensus data, and do not constitute a recommendation to buy or sell any stock, and they do not take account of your objectives, or your financial situation. Note that AnalystConsensusTarget's analysis may not factor in the latest price-sensitive company announcements or qualitative material.


