


Catalysts
About FGI Industries
FGI Industries designs, sources and supplies branded and private label kitchen and bath products across sanitaryware, bath furniture, shower systems and cabinetry to retail and professional channels globally.
What are the underlying business or industry changes driving this perspective?
- Acceleration of global sourcing diversification through the China Plus One strategy across all product categories, which is intended to reduce tariff risk, stabilize input costs and support a return to upper 20s gross margins.
- Growth in core categories such as sanitaryware, bath furniture and Covered Bridge cabinetry, supported by new program wins and market aligned pricing, positioning revenue to scale in line with or ahead of industry demand.
- Expansion of the Covered Bridge and digital Isla Porter initiatives, including higher dealer counts and AI backed custom kitchen sales, which can shift the portfolio toward higher value offerings and potentially lift earnings over time.
- Geographic expansion in Europe and India from a relatively small base, supported by early growth in Europe, which can provide a multi year runway for international revenue gains and operating leverage.
- Order pipeline with new program launches anticipated in the back half of 2025, coupled with disciplined expense management, creating potential for operating margin improvement as tariff uncertainty eases.
Assumptions
This narrative explores a more optimistic perspective on FGI Industries compared to the consensus, based on a Fair Value that aligns with the bullish cohort of analysts. How have these above catalysts been quantified?
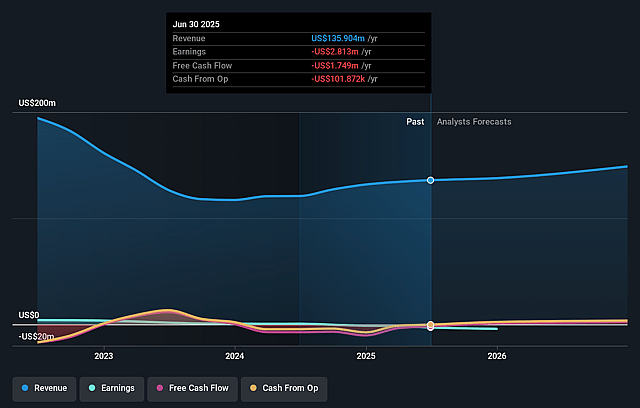
- The bullish analysts are assuming FGI Industries's revenue will grow by 5.6% annually over the next 3 years.
- The bullish analysts are not forecasting that FGI Industries will become profitable in next 3 years. To represent the Analyst Price Target as a Future PE Valuation we will estimate FGI Industries's profit margin will increase from -2.9% to the average US Trade Distributors industry of 6.5% in 3 years.
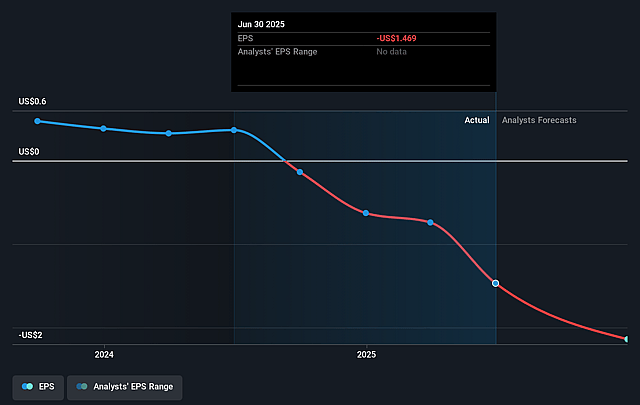
- If FGI Industries's profit margin were to converge on the industry average, you could expect earnings to reach $10.3 million (and earnings per share of $5.36) by about December 2028, up from $-3.9 million today.
- In order for the above numbers to justify the price target of the more bullish analyst cohort, the company would need to trade at a PE ratio of 2.7x on those 2028 earnings, up from -3.1x today. This future PE is lower than the current PE for the US Trade Distributors industry at 19.9x.
- The bullish analysts expect the number of shares outstanding to grow by 0.12% per year for the next 3 years.
- To value all of this in today's terms, we will use a discount rate of 12.5%, as per the Simply Wall St company report.
Risks
What could happen that would invalidate this narrative?
- The increasingly unpredictable global tariff environment could lead to repeated order pauses similar to those seen in early Q2 2025. This could compress pricing power and force further concessions to customers and vendors, which would pressure revenue growth and structurally lower gross margins and earnings over time.
- The China Plus One sourcing strategy requires rapid factory qualification and supply chain reconfiguration across all product categories. Any delays, quality issues or cost overruns in this transition could erode the expected return to gross margins in the upper 20s and prolong operating losses.
- Despite pockets of strength in Sanitaryware, Bath Furniture and Covered Bridge cabinetry, the 11.2% decline in Shower Systems revenue and flat to slightly negative performance in the U.S. highlight end market fragility. If these core channels do not recover in line with management expectations, total revenue growth may fall below guidance while fixed costs continue to weigh on operating income.
- Strategic investments in initiatives such as Isla Porter, European and Indian expansion and warehouse optimization are raising operating expenses ahead of scale. If these long term bets fail to deliver above market organic growth, the company may remain in a GAAP operating loss position with constrained net income and limited flexibility to fund further growth.
- Management is guiding to a wide 2025 range from negative adjusted net income of 1.9 million to positive 1 million. If tariff volatility, customer caution or execution missteps push outcomes toward the lower end of this range or below it, the market could reassess the company’s ability to achieve sustainable profitability and re rate the shares on weaker earnings expectations.
Valuation
How have all the factors above been brought together to estimate a fair value?
- The assumed bullish price target for FGI Industries is $10.0, which represents up to two standard deviations above the consensus price target of $8.5. This valuation is based on what can be assumed as the expectations of FGI Industries's future earnings growth, profit margins and other risk factors from analysts on the bullish end of the spectrum.
- However, there is a degree of disagreement amongst analysts, with the most bullish reporting a price target of $10.0, and the most bearish reporting a price target of just $7.0.
- In order for you to agree with the more bullish analyst cohort, you'd need to believe that by 2028, revenues will be $159.9 million, earnings will come to $10.3 million, and it would be trading on a PE ratio of 2.7x, assuming you use a discount rate of 12.5%.
- Given the current share price of $6.4, the analyst price target of $10.0 is 36.0% higher.
- We always encourage you to reach your own conclusions though. So sense check these analyst numbers against your own assumptions and expectations based on your understanding of the business and what you believe is probable.
Have other thoughts on FGI Industries?
Create your own narrative on this stock, and estimate its Fair Value using our Valuator tool.
Create NarrativeHow well do narratives help inform your perspective?
Disclaimer
AnalystHighTarget is a tool utilizing a Large Language Model (LLM) that ingests data on consensus price targets, forecasted revenue and earnings figures, as well as the transcripts of earnings calls to produce qualitative analysis. The narratives produced by AnalystHighTarget are general in nature and are based solely on analyst data and publicly-available material published by the respective companies. These scenarios are not indicative of the company's future performance and are exploratory in nature. Simply Wall St has no position in the company(s) mentioned. Simply Wall St may provide the securities issuer or related entities with website advertising services for a fee, on an arm's length basis. These relationships have no impact on the way we conduct our business, the content we host, or how our content is served to users. The price targets and estimates used are consensus data, and do not constitute a recommendation to buy or sell any stock, and they do not take account of your objectives, or your financial situation. Note that AnalystHighTarget's analysis may not factor in the latest price-sensitive company announcements or qualitative material.

