
What Happened in the Market This Week?
Market Insight for 11th April - 18th April
Most markets were closed due to public holidays on Friday the 15th and Monday the 18th of April.
The U.S. Market finished 1.85% lower last week, as tech and telecom stocks took the brunt of the fall while energy stocks extended their gains by 1.1% for a total of 63% return from a year ago. While tech stocks have lost 3.5% over the last 12 months, the telecom and consumer discretionary stocks are the worst performers with both industries falling about 18% for the period.
In the past week there were few key developments:
- The U.S. posted a 40-year record inflation rate of 8.5% (6.5% excluding food & energy)
- Natural gas prices continued rising with an unprecedented 15% jump
- China is starting to see lockdown-driven supply chain pressures, impacting production and freight prices
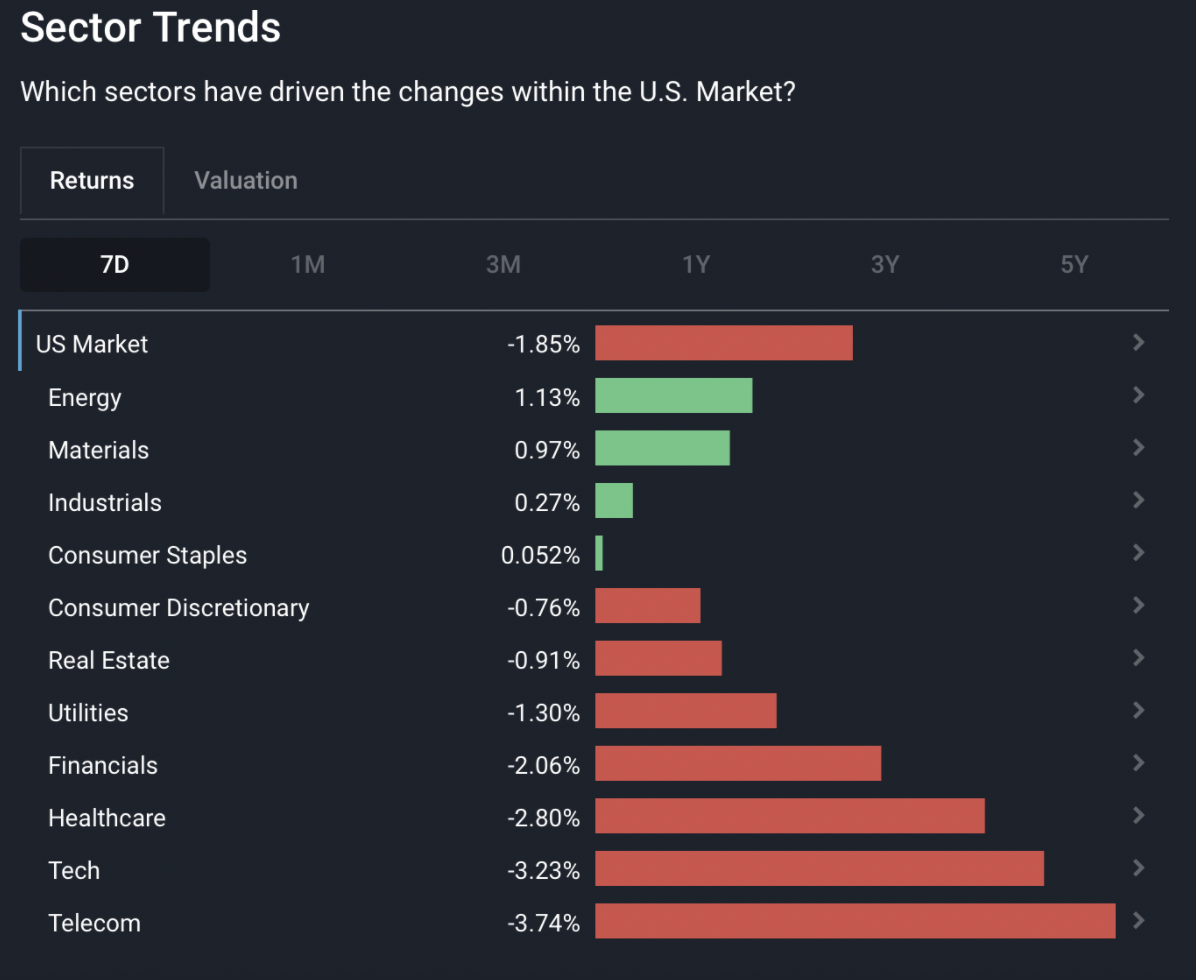
US Sectors 7D performance - April 18th, 2022
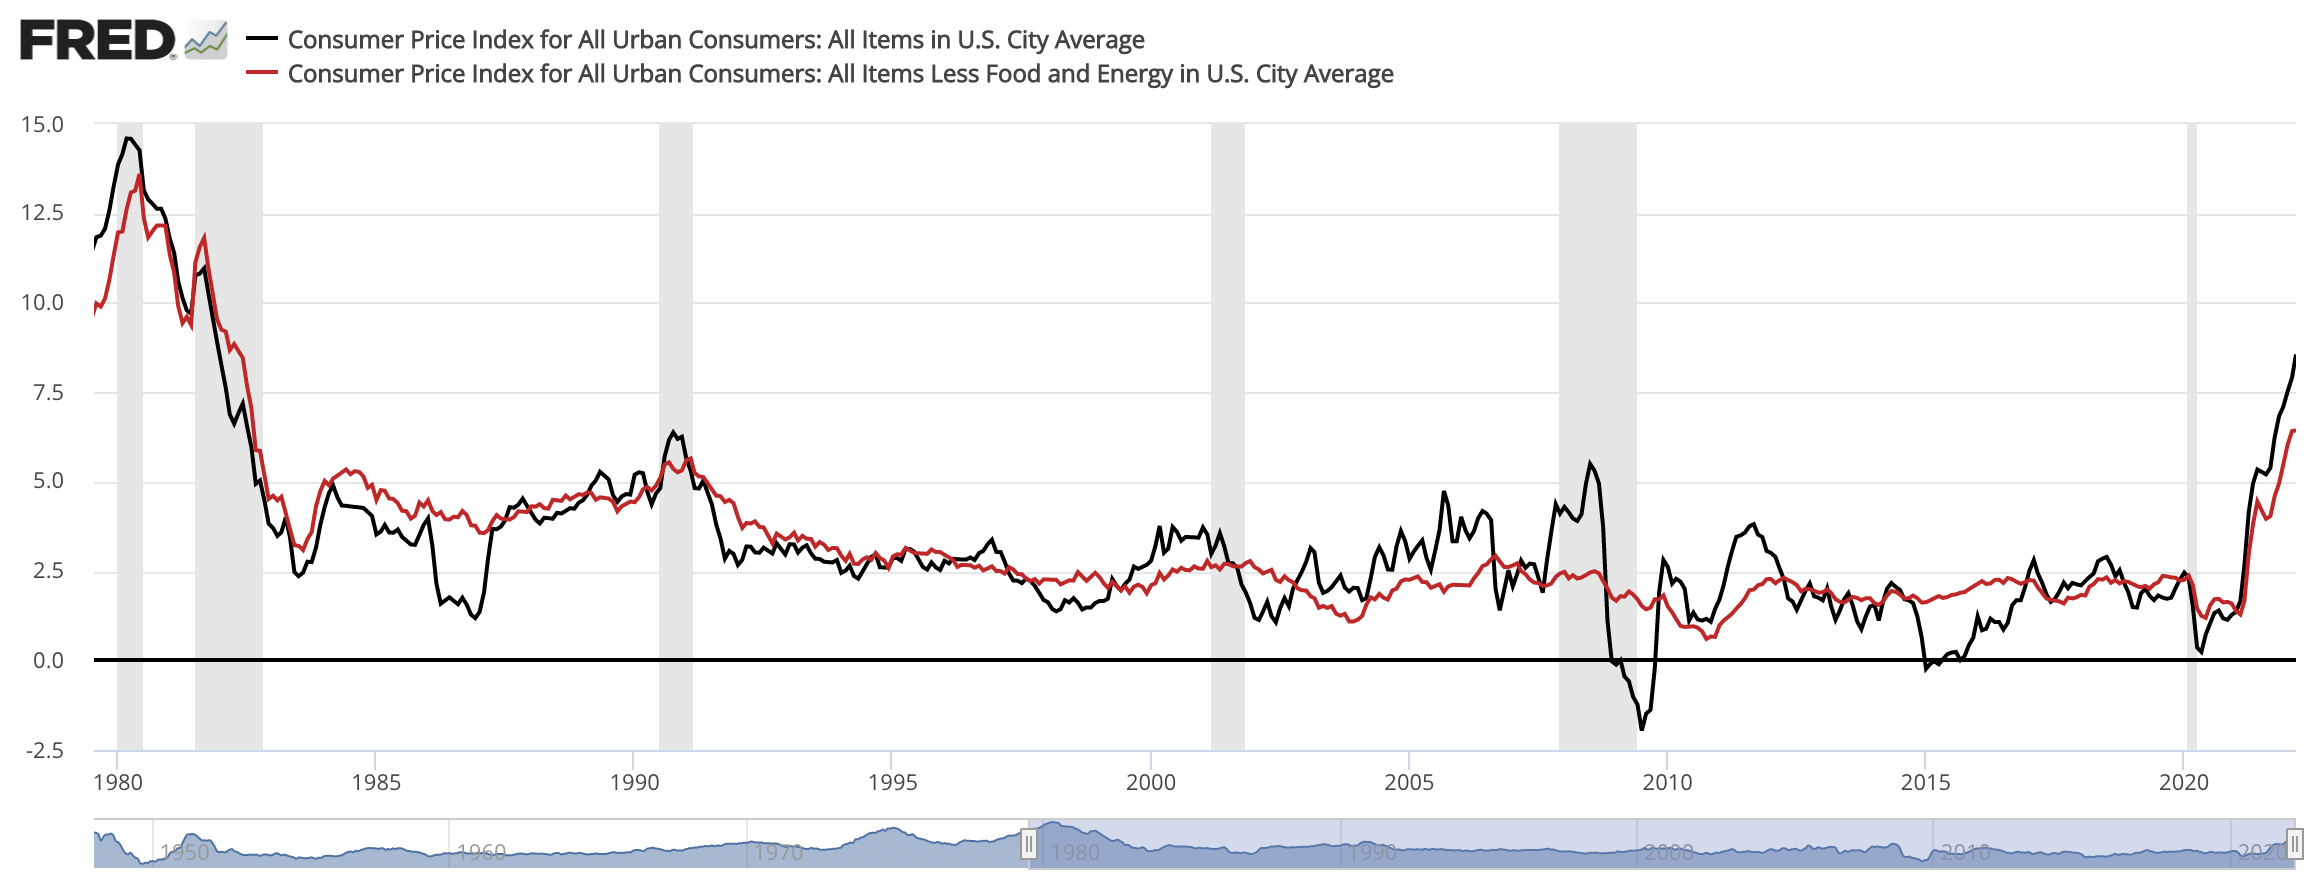
Inflation reaches new highs
Inflation data for March came out this week, and the U.S. grew annual inflation to 8.5%, up from 7.9% in February. Mostly driven by energy (up by 32%) and food (up by 8.8%) prices, U.S. inflation reached a 40-year high. Even inflation excluding food and energy, which is called “Core CPI”, posted a 6.5% increase.
When we look across geographies, we see that inflation has risen substantially in most of the developed economies. Interest rates are also starting to go up, however they seem to be lagging the effective base rates at which the market borrows.
The risk-free rate is a crucial part of calculating the required return for stocks, and as it increases, the value of the expected future cash flows of stocks typically decreases. It is also used in constructing interest rates for loans. Companies that have a lot of outstanding debt will be forced to refinance their loans at a more expensive rate which, all else being equal, can lead to even smaller cash flows. So companies that have chosen to take on a lot of debt in their capital structure tend to fare worse than those that utilize debt sparingly. We curated a list of Strong Balance sheet stocks that score well in this area (and it can be filtered further by any market, industry or other metric).
An additional pressure point for consumers will be the fact that the 30-year fixed mortgage rate in the U.S. jumped to 5% for the first time since 2011 - This will likely leave consumers with less spending power as their expenses increase.
In the table below, we aggregated some key economic indicators, which showcase the relationship between interest rates, inflation and economic growth.
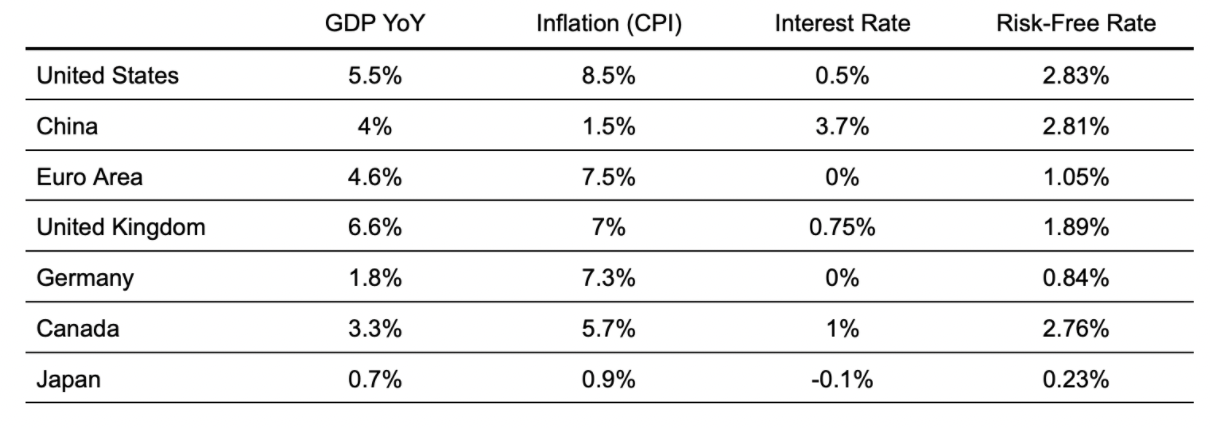
We can see that the U.S. has a lower GDP growth rate compared to its inflation, which means that real GDP declined in the last year. A decline in real GDP is generally a worrying sign in macroeconomics as it signals declining economic activity. Annual GDP growth is forecasted to revert to around 2.9% for 2022, and some expect inflation to subside to around 5.5% at the end of 2022. While that would still generate a negative real GDP rate, it would be a slight improvement from today’s figures.
The Bank of Canada also hiked rates to 1% - its biggest increase since 2000. The move will lead to higher mortgage costs for Canadian consumers. Economists expect rates to go up to 2% in the future.
The Insight: Stocks are dependent on the relationship between real growth and inflation. When inflation is higher than economic growth, investors will likely prioritize stocks that can deliver more predictable returns in the near future as opposed to speculative growth stocks whose future is less certain. The rise in the risk free rate (as measured by the government 10-Year Bond Yield) indicates that companies will need to increase their cash flow returns in order to retain their stock price levels.
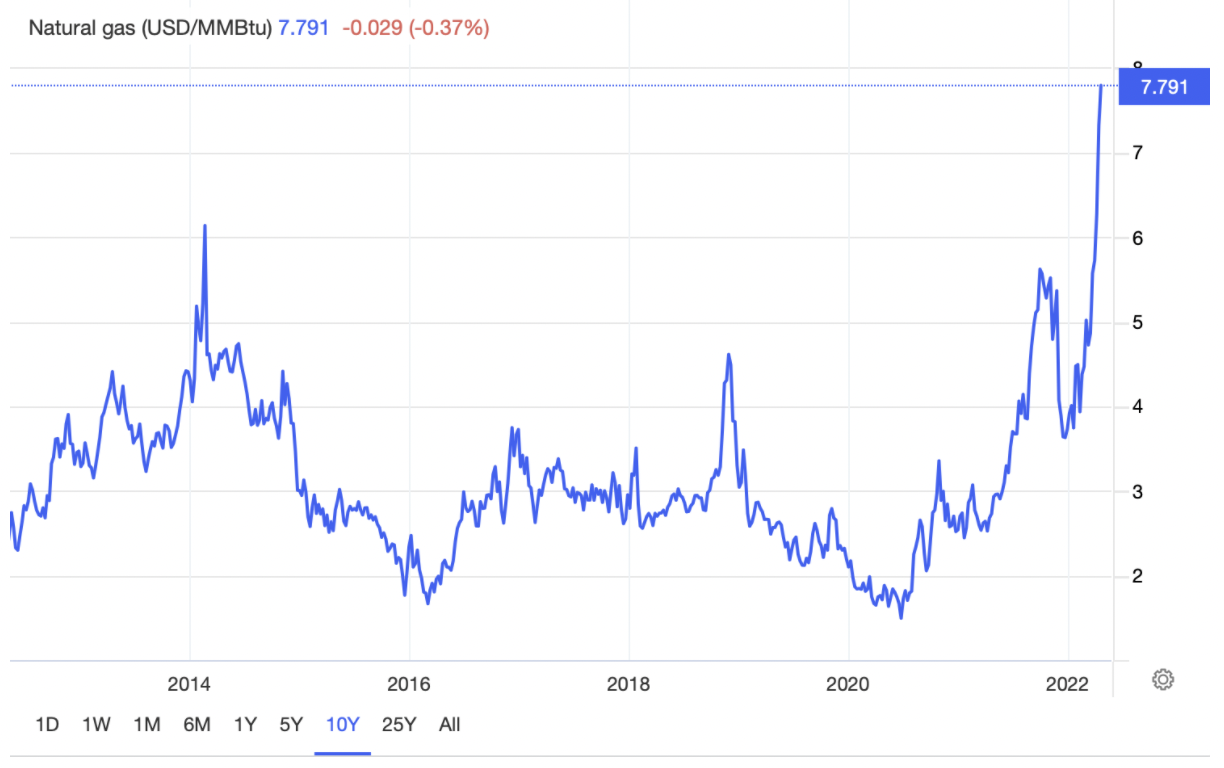
Pressures in Energy Markets
Commodity prices are back in the focus, as natural gas has made significant jumps yet again, and the U.S. is enacting measures to reduce the impact of rising energy prices.
Energy commodities such as crude oil and natural gas are displaying further signs of shortages, with markets showing increases in commodity prices arising from the lack of supply. Last week, Natural Gas prices saw a large 15% move, second only to the increase in Heating Oil prices which jumped 15.3%.
Natural Gas prices continue to rise as U.S. Liquid Natural Gas attempts to compensate for the increase in demand from European markets. European inventories of Natural Gas continue to come under pressure as Europe and Germany are starting to pursue a policy for energy independence.
In order to alleviate some pressure from energy demand, the U.S. has decided to release 180 million barrels of oil from its emergency oil reserves, at a rate of 1 million barrels per day starting next month. The program will draw from the Strategic Petroleum Reserve which currently holds 564.6 million barrels. This would be the country’s biggest release of oil from its stockpile since it was created in 1970.
Additionally, the President of the U.S. made an announcement on April 12th, where he called on partners to join with similar measures, while prompting oil producers to increase production.
The Insight: Energy prices are the largest contributing factor in the latest inflation figures, as well as a key component in production input across industries. Currently, the market shows that the rise in energy prices will impose additional costs on companies, likely impacting future earnings. Investors are seeing short-term approaches to curb energy inflation, however an expansion in energy generation and delivery capacities will take some time. Technology/software stocks will possibly be the least affected in the future, while energy companies already saw a wave of increased stock performance.
Supply Chain Pressures In China
Nearly 400 million people are under full or partial lockdown in China, representing around 40% or US$7.2 trillion of its annual GDP - (CNN). Economists are struggling to estimate the future production and delivery implications.
The city of Shanghai, home to approximately 26 million people, is experiencing more than 20 days of hard lockdown. This comes as a result from China’s “Zero Covid” policy, where the government imposes quarantine measures in order to control the spread of the virus.
For investors, this has resulted in further supply chain delays and production disruptions. For example, NIO (NYSE:NIO) halted vehicle production for a week because suppliers lacked manufacturing parts, before finally restarting production this coming Thursday. Tesla’s (NASDAQ:TSLA) plant in Shanghai has been shut down since late March, however potential easing of Shanghai lockdowns may mean the impact on the company’s annual car production from that factory is minimal.
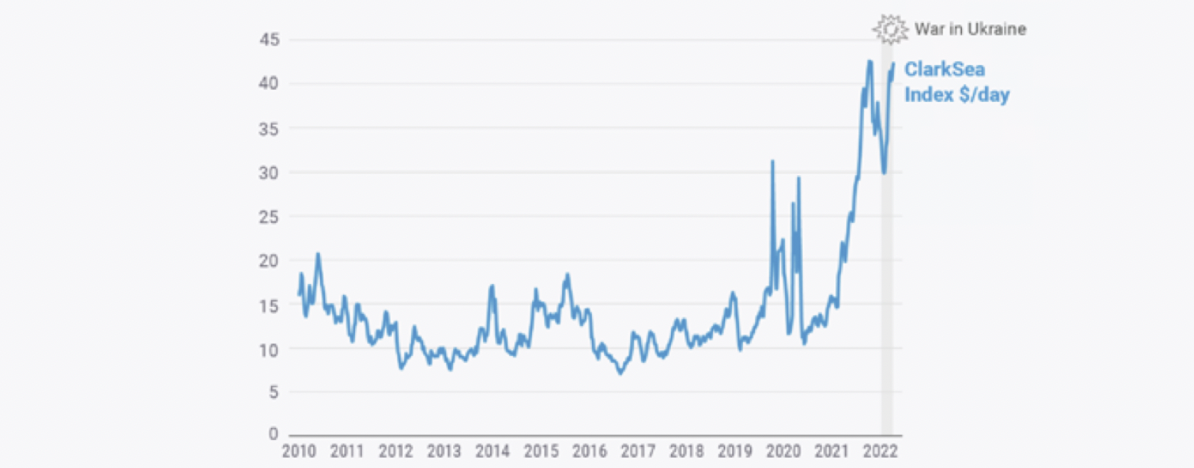
Supply chain delays are resulting in freight prices picking up again, after experiencing brief normalization before the invasion of Ukraine. The ClarkSea Index measures charter container ship spot prices, which remain elevated, driven by port congestion and supply chain delays.
China is a net exporting country, delivering net export goods valued at US$121.5b in February, making it one of the largest exporting countries in the world. The extended COVID lockdowns in the country can impair manufacturing capacities, produce longer delays and freight congestion, further amplify freight prices, and diminish the economic power of both China and Western markets.
The Insight: China is under a series of lockdowns impacting around 40% of their GDP. The effects of this situation can be longer lasting as delays in manufacturing and supply chain can have ripple effects across economies - further pressuring prices.
Looking Ahead
Two major economic indicators are being reported this week. On Thursday, April 28th, the U.S. will be reporting its Q1 GDP growth rate, estimated to be around 1%. The Euro Area will post its Quarterly and Annual GDP on Friday, 29th April - with the quarterly GDP forecasted to come at 0.3%.
Earnings season is currently underway, and for investors that means it is a time to revise investment theses as new information becomes available. It’s important to monitor and review the latest figures and developments coming out from stocks you either own or are watching, and see if these developments are in line with your existing thesis, or if your thesis needs updating (either positively or negatively).
The most notable companies posting earnings this week are:
- Bank of America (NYSE:BAC)
- Nucor (NYSE:NUE)
- Tesla (NASDAQ:TSLA)
- Freeport-McMoRan (NYSE:FCX)
- Lockheed Martin (NYSE:LMT)
- American Express (NYSE:AXP)
- Procter & Gamble (NYSE:PG)
- Johnson & Johnson (NYSE:JNJ)
- Abbot (NYSE:ABT)
- American Airlines (NASDAQ:AAL)
- SAP (XTRA:SAP)
- Lam Research (NASDAQ:LRCX)
- AT&T (NYSE:T)
- Netflix (NASDAQ:NFLX)
- Snap (NYSE:SNAP)
While many investors are concerned about the future performance of the market, it is worth noting that there are still bullish analysts who anticipate a growth in earnings and a higher level for stock indices - such as the S&P 500. One researcher, Dr. Ed Yardeni, forecasts that the S&P 500 can reach a level between 4200 and 5000 in 2022, which may not be a bad result given the current economic landscape.
Until next week,
Invest Well,
Simply Wall St
Have feedback on this article? Concerned about the content? Get in touch with us directly. Alternatively, email editorial-team@simplywallst.com
Simply Wall St analyst Goran Damchevski and Simply Wall St have no position in any of the companies mentioned. This article is general in nature. We provide commentary based on historical data and analyst forecasts only using an unbiased methodology and our articles are not intended to be financial advice. It does not constitute a recommendation to buy or sell any stock and does not take account of your objectives, or your financial situation. We aim to bring you long-term focused analysis driven by fundamental data. Note that our analysis may not factor in the latest price-sensitive company announcements or qualitative material.
Goran Damchevski
Goran is an Equity Analyst and Writer at Simply Wall St with over 5 years of experience in financial analysis and company research. Goran previously worked in a seed-stage startup as a capital markets research analyst and product lead and developed a financial data platform for equity investors.


