
Advertisement
- South Africa
- /
- IT
- /
- JSE:PBG
PBT Group Limited's (JSE:PBG) Fundamentals Look Pretty Strong: Could The Market Be Wrong About The Stock?

With its stock down 26% over the past three months, it is easy to disregard PBT Group (JSE:PBG). However, stock prices are usually driven by a company’s financial performance over the long term, which in this case looks quite promising. Particularly, we will be paying attention to PBT Group's ROE today.
Return on equity or ROE is a key measure used to assess how efficiently a company's management is utilizing the company's capital. In short, ROE shows the profit each dollar generates with respect to its shareholder investments.
See our latest analysis for PBT Group
How Do You Calculate Return On Equity?
Return on equity can be calculated by using the formula:
Return on Equity = Net Profit (from continuing operations) ÷ Shareholders' Equity
So, based on the above formula, the ROE for PBT Group is:
26% = R95m ÷ R362m (Based on the trailing twelve months to September 2022).
The 'return' is the yearly profit. One way to conceptualize this is that for each ZAR1 of shareholders' capital it has, the company made ZAR0.26 in profit.
What Has ROE Got To Do With Earnings Growth?
We have already established that ROE serves as an efficient profit-generating gauge for a company's future earnings. We now need to evaluate how much profit the company reinvests or "retains" for future growth which then gives us an idea about the growth potential of the company. Assuming everything else remains unchanged, the higher the ROE and profit retention, the higher the growth rate of a company compared to companies that don't necessarily bear these characteristics.
PBT Group's Earnings Growth And 26% ROE
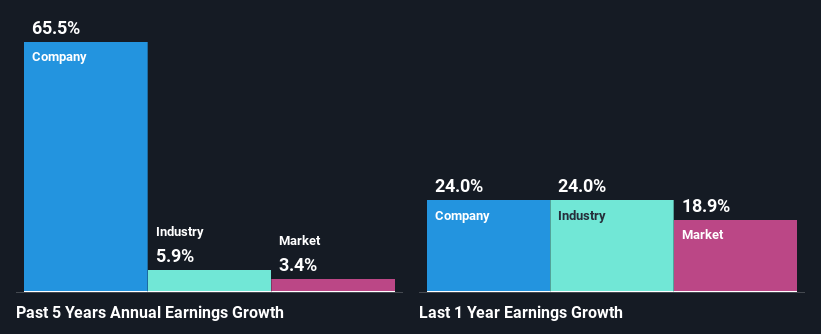
To start with, PBT Group's ROE looks acceptable. And on comparing with the industry, we found that the the average industry ROE is similar at 25%. This probably goes some way in explaining PBT Group's significant 66% net income growth over the past five years amongst other factors. We believe that there might also be other aspects that are positively influencing the company's earnings growth. For instance, the company has a low payout ratio or is being managed efficiently.
As a next step, we compared PBT Group's net income growth with the industry, and pleasingly, we found that the growth seen by the company is higher than the average industry growth of 13%.
The basis for attaching value to a company is, to a great extent, tied to its earnings growth. The investor should try to establish if the expected growth or decline in earnings, whichever the case may be, is priced in. This then helps them determine if the stock is placed for a bright or bleak future. Is PBT Group fairly valued compared to other companies? These 3 valuation measures might help you decide.
Is PBT Group Making Efficient Use Of Its Profits?
The high three-year median payout ratio of 51% (implying that it keeps only 49% of profits) for PBT Group suggests that the company's growth wasn't really hampered despite it returning most of the earnings to its shareholders.
Moreover, PBT Group is determined to keep sharing its profits with shareholders which we infer from its long history of paying a dividend for at least ten years.
Summary
In total, we are pretty happy with PBT Group's performance. We are particularly impressed by the considerable earnings growth posted by the company, which was likely backed by its high ROE. While the company is paying out most of its earnings as dividends, it has been able to grow its earnings in spite of it, so that's probably a good sign. Up till now, we've only made a short study of the company's growth data. So it may be worth checking this free detailed graph of PBT Group's past earnings, as well as revenue and cash flows to get a deeper insight into the company's performance.
New: Manage All Your Stock Portfolios in One Place
We've created the ultimate portfolio companion for stock investors, and it's free.
• Connect an unlimited number of Portfolios and see your total in one currency
• Be alerted to new Warning Signs or Risks via email or mobile
• Track the Fair Value of your stocks
Have feedback on this article? Concerned about the content? Get in touch with us directly. Alternatively, email editorial-team (at) simplywallst.com.
This article by Simply Wall St is general in nature. We provide commentary based on historical data and analyst forecasts only using an unbiased methodology and our articles are not intended to be financial advice. It does not constitute a recommendation to buy or sell any stock, and does not take account of your objectives, or your financial situation. We aim to bring you long-term focused analysis driven by fundamental data. Note that our analysis may not factor in the latest price-sensitive company announcements or qualitative material. Simply Wall St has no position in any stocks mentioned.
About JSE:PBG
PBT Group
Provides specialized consulting services to finance, insurance, medical healthcare, retail, telecommunication, and other sectors in South Africa, Europe, and the United Kingdom.
Excellent balance sheet average dividend payer.
Market Insights

Advertisement
Community Narratives
Groundbreaking therapies that could change the treatment landscape for PTSD, fibromyalgia, MS & Alzheimer’s
Fair Value US$6.20|82.7% undervalued
CM
Community Contributor
DigitalOcean Will Grow 14% by Embracing AI with Paperspace Acquisition
Fair Value US$50.00|36.8% undervalued
NE
Community Contributor
Viant Technology: A Rising AdTech Challenger in the AI-Powered CTV Market
Fair Value US$38.61|61.4% undervalued
BL
Community Contributor
Volvo will Accelerate Forward into Electric and Autonomous Leadership in Five Years
Fair Value SEK 438.80|37.1% undervalued
UN
Community Contributor