
Advertisement
- South Africa
- /
- Specialty Stores
- /
- JSE:SPG
Super Group (JSE:SPG investor three-year losses grow to 0.9% as the stock sheds R5.8b this past week
In order to justify the effort of selecting individual stocks, it's worth striving to beat the returns from a market index fund. But if you try your hand at stock picking, you risk returning less than the market. Unfortunately, that's been the case for longer term Super Group Limited (JSE:SPG) shareholders, since the share price is down 59% in the last three years, falling well short of the market return of around 42%. Unfortunately the share price momentum is still quite negative, with prices down 58% in thirty days.
Given the past week has been tough on shareholders, let's investigate the fundamentals and see what we can learn.
While markets are a powerful pricing mechanism, share prices reflect investor sentiment, not just underlying business performance. One flawed but reasonable way to assess how sentiment around a company has changed is to compare the earnings per share (EPS) with the share price.
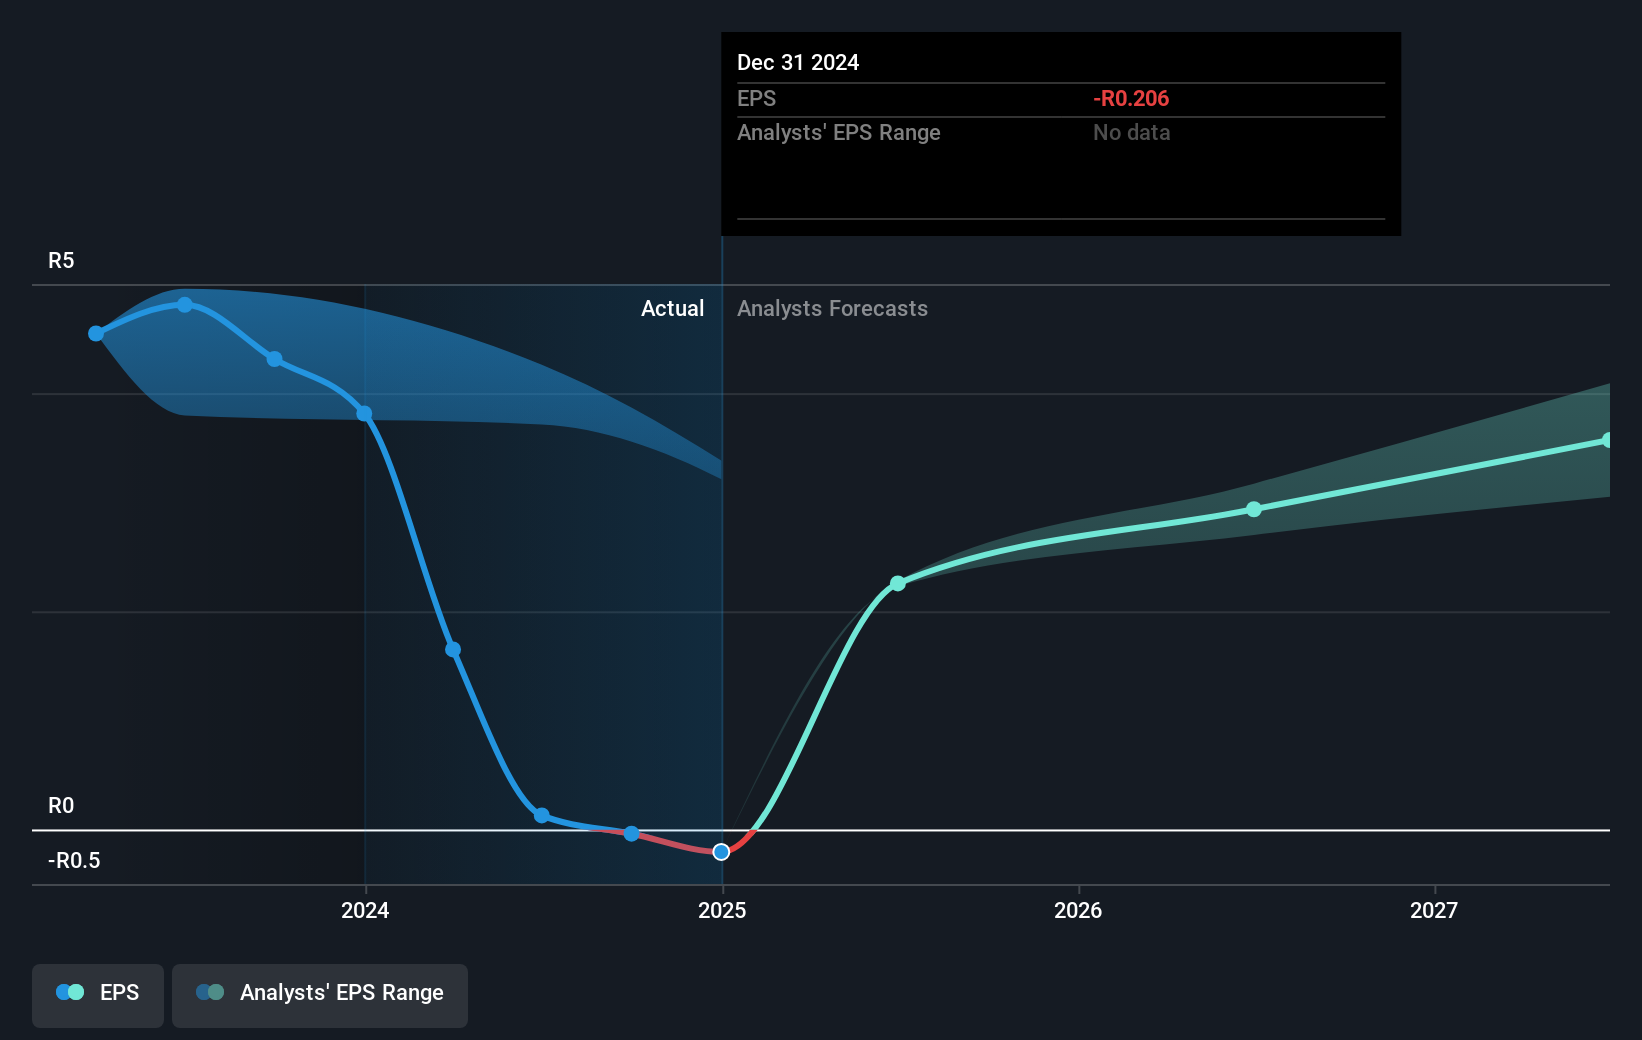
Over the three years that the share price declined, Super Group's earnings per share (EPS) dropped significantly, falling to a loss. Extraordinary items contributed to this situation. Due to the loss, it's not easy to use EPS as a reliable guide to the business. But it's safe to say we'd generally expect the share price to be lower as a result!
The image below shows how EPS has tracked over time (if you click on the image you can see greater detail).
Before buying or selling a stock, we always recommend a close examination of historic growth trends, available here.

What About Dividends?
As well as measuring the share price return, investors should also consider the total shareholder return (TSR). The TSR incorporates the value of any spin-offs or discounted capital raisings, along with any dividends, based on the assumption that the dividends are reinvested. It's fair to say that the TSR gives a more complete picture for stocks that pay a dividend. We note that for Super Group the TSR over the last 3 years was -0.9%, which is better than the share price return mentioned above. And there's no prize for guessing that the dividend payments largely explain the divergence!
A Different Perspective
Super Group shareholders are down 4.2% for the year (even including dividends), but the market itself is up 20%. Even the share prices of good stocks drop sometimes, but we want to see improvements in the fundamental metrics of a business, before getting too interested. Longer term investors wouldn't be so upset, since they would have made 11%, each year, over five years. If the fundamental data continues to indicate long term sustainable growth, the current sell-off could be an opportunity worth considering. I find it very interesting to look at share price over the long term as a proxy for business performance. But to truly gain insight, we need to consider other information, too. Case in point: We've spotted 2 warning signs for Super Group you should be aware of.
If you are like me, then you will not want to miss this free list of undervalued small caps that insiders are buying.
Please note, the market returns quoted in this article reflect the market weighted average returns of stocks that currently trade on South African exchanges.
New: Manage All Your Stock Portfolios in One Place
We've created the ultimate portfolio companion for stock investors, and it's free.
• Connect an unlimited number of Portfolios and see your total in one currency
• Be alerted to new Warning Signs or Risks via email or mobile
• Track the Fair Value of your stocks
Have feedback on this article? Concerned about the content? Get in touch with us directly. Alternatively, email editorial-team (at) simplywallst.com.
This article by Simply Wall St is general in nature. We provide commentary based on historical data and analyst forecasts only using an unbiased methodology and our articles are not intended to be financial advice. It does not constitute a recommendation to buy or sell any stock, and does not take account of your objectives, or your financial situation. We aim to bring you long-term focused analysis driven by fundamental data. Note that our analysis may not factor in the latest price-sensitive company announcements or qualitative material. Simply Wall St has no position in any stocks mentioned.
About JSE:SPG
Super Group
Engages in the supply chain management, mobility, dealership, and fleet management activities in South Africa, sub-Saharan Africa, Europe, and the United Kingdom.
Flawless balance sheet and fair value.
Similar Companies
Market Insights

Advertisement
Community Narratives
MINISO's fair value is projected at 26.69 with an anticipated PE ratio shift of 20x
Fair Value US$24.03|11.0% undervalued
BE
Community Contributor
Procter & Gamble: A Dividend Giant Facing Slowing Growth
Fair Value US$119.81|23.3% overvalued
AN
Community Contributor
Eli Lilly's Future Growth Driven by Tirzepatide and Favorable Market Conditions
Fair Value US$1.19k|13.8% undervalued
EA
Community Contributor