
Advertisement
Sappi (JSE:SAP investor one-year losses grow to 38% as the stock sheds R1.7b this past week
The simplest way to benefit from a rising market is to buy an index fund. But if you buy individual stocks, you can do both better or worse than that. That downside risk was realized by Sappi Limited (JSE:SAP) shareholders over the last year, as the share price declined 41%. That contrasts poorly with the market return of 29%. To make matters worse, the returns over three years have also been really disappointing (the share price is 37% lower than three years ago). Shareholders have had an even rougher run lately, with the share price down 14% in the last 90 days.
Since Sappi has shed R1.7b from its value in the past 7 days, let's see if the longer term decline has been driven by the business' economics.
While the efficient markets hypothesis continues to be taught by some, it has been proven that markets are over-reactive dynamic systems, and investors are not always rational. One way to examine how market sentiment has changed over time is to look at the interaction between a company's share price and its earnings per share (EPS).
Sappi managed to increase earnings per share from a loss to a profit, over the last 12 months.
The company was close to break-even last year, so earnings per share of US$0.16 strike us as less than amazing. Taking a look at the share price, it seems that investors were expecting better from the company. Given the improvement, though, contrarian investors might want to take a closer look.
The image below shows how EPS has tracked over time (if you click on the image you can see greater detail).
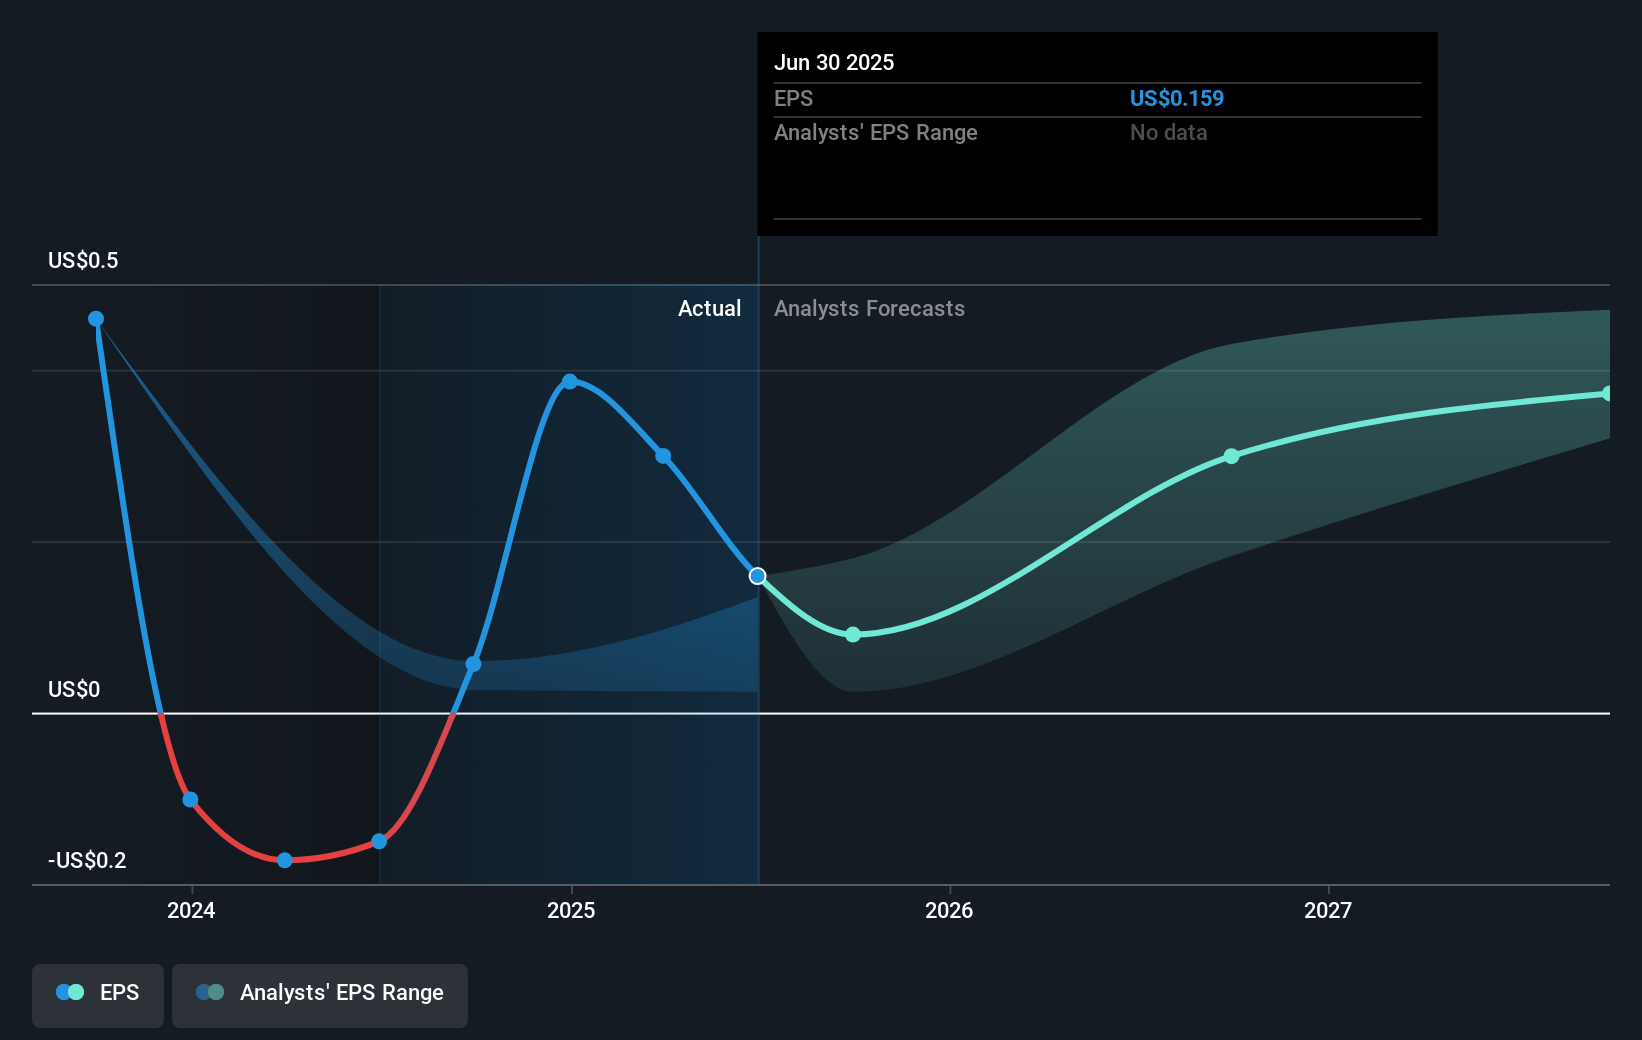
We know that Sappi has improved its bottom line lately, but is it going to grow revenue? This free report showing analyst revenue forecasts should help you figure out if the EPS growth can be sustained.
What About Dividends?
When looking at investment returns, it is important to consider the difference between total shareholder return (TSR) and share price return. Whereas the share price return only reflects the change in the share price, the TSR includes the value of dividends (assuming they were reinvested) and the benefit of any discounted capital raising or spin-off. Arguably, the TSR gives a more comprehensive picture of the return generated by a stock. In the case of Sappi, it has a TSR of -38% for the last 1 year. That exceeds its share price return that we previously mentioned. This is largely a result of its dividend payments!
A Different Perspective
Sappi shareholders are down 38% for the year (even including dividends), but the market itself is up 29%. However, keep in mind that even the best stocks will sometimes underperform the market over a twelve month period. On the bright side, long term shareholders have made money, with a gain of 6% per year over half a decade. If the fundamental data continues to indicate long term sustainable growth, the current sell-off could be an opportunity worth considering. While it is well worth considering the different impacts that market conditions can have on the share price, there are other factors that are even more important. To that end, you should learn about the 3 warning signs we've spotted with Sappi (including 1 which is potentially serious) .
We will like Sappi better if we see some big insider buys. While we wait, check out this free list of undervalued stocks (mostly small caps) with considerable, recent, insider buying.
Please note, the market returns quoted in this article reflect the market weighted average returns of stocks that currently trade on South African exchanges.
New: Manage All Your Stock Portfolios in One Place
We've created the ultimate portfolio companion for stock investors, and it's free.
• Connect an unlimited number of Portfolios and see your total in one currency
• Be alerted to new Warning Signs or Risks via email or mobile
• Track the Fair Value of your stocks
Have feedback on this article? Concerned about the content? Get in touch with us directly. Alternatively, email editorial-team (at) simplywallst.com.
This article by Simply Wall St is general in nature. We provide commentary based on historical data and analyst forecasts only using an unbiased methodology and our articles are not intended to be financial advice. It does not constitute a recommendation to buy or sell any stock, and does not take account of your objectives, or your financial situation. We aim to bring you long-term focused analysis driven by fundamental data. Note that our analysis may not factor in the latest price-sensitive company announcements or qualitative material. Simply Wall St has no position in any stocks mentioned.
About JSE:SAP
Sappi
Engages in the provision of materials made from woodfiber-based renewable resources in Europe, North America, and South Africa.
Undervalued with moderate growth potential.
Similar Companies
Market Insights

Advertisement
Community Narratives
The "Molecular Pencil": Why Beam's Technology is Built to Win
Fair Value US$65.01|65.4% undervalued
DA
Community Contributor
The silent giant behind virtually every advanced chip powering AI, smartphones, and modern infrastructure.
Fair Value US$310.00|6.1% undervalued
OS
Community Contributor
ADP Stock: Solid Fundamentals, But AI Investments Test Its Margin Resilience
Fair Value US$387.77|34.2% undervalued
YI
Community Contributor
MINISO's fair value is projected at 26.69 with an anticipated PE ratio shift of 20x
Fair Value US$24.03|9.6% undervalued
BE
Community Contributor