- South Africa
- /
- Metals and Mining
- /
- JSE:KIO
Kumba Iron Ore (JSE:KIO) stock falls 7.0% in past week as three-year earnings and shareholder returns continue downward trend


As an investor its worth striving to ensure your overall portfolio beats the market average. But the risk of stock picking is that you will likely buy under-performing companies. We regret to report that long term Kumba Iron Ore Limited (JSE:KIO) shareholders have had that experience, with the share price dropping 42% in three years, versus a market return of about 28%. The falls have accelerated recently, with the share price down 32% in the last three months. This could be related to the recent financial results - you can catch up on the most recent data by reading our company report.
With the stock having lost 7.0% in the past week, it's worth taking a look at business performance and seeing if there's any red flags.
View our latest analysis for Kumba Iron Ore
To paraphrase Benjamin Graham: Over the short term the market is a voting machine, but over the long term it's a weighing machine. One way to examine how market sentiment has changed over time is to look at the interaction between a company's share price and its earnings per share (EPS).
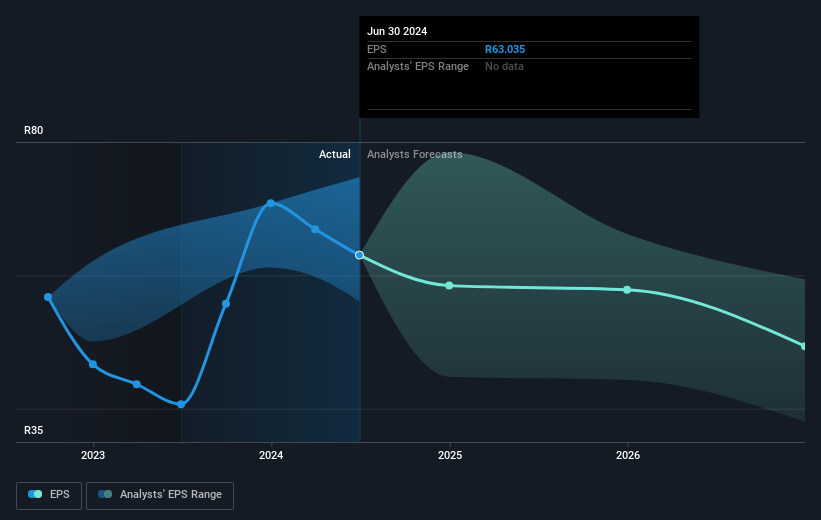
During the three years that the share price fell, Kumba Iron Ore's earnings per share (EPS) dropped by 19% each year. This change in EPS is reasonably close to the 16% average annual decrease in the share price. So it seems that investor expectations of the company are staying pretty steady, despite the disappointment. Rather, the share price has approximately tracked EPS growth.
You can see how EPS has changed over time in the image below (click on the chart to see the exact values).
We know that Kumba Iron Ore has improved its bottom line lately, but is it going to grow revenue? If you're interested, you could check this free report showing consensus revenue forecasts.
What About Dividends?
As well as measuring the share price return, investors should also consider the total shareholder return (TSR). Whereas the share price return only reflects the change in the share price, the TSR includes the value of dividends (assuming they were reinvested) and the benefit of any discounted capital raising or spin-off. It's fair to say that the TSR gives a more complete picture for stocks that pay a dividend. In the case of Kumba Iron Ore, it has a TSR of -21% for the last 3 years. That exceeds its share price return that we previously mentioned. This is largely a result of its dividend payments!
A Different Perspective
Kumba Iron Ore shareholders are down 1.1% for the year (even including dividends), but the market itself is up 16%. However, keep in mind that even the best stocks will sometimes underperform the market over a twelve month period. Longer term investors wouldn't be so upset, since they would have made 10%, each year, over five years. If the fundamental data continues to indicate long term sustainable growth, the current sell-off could be an opportunity worth considering. It's always interesting to track share price performance over the longer term. But to understand Kumba Iron Ore better, we need to consider many other factors. For example, we've discovered 2 warning signs for Kumba Iron Ore (1 is concerning!) that you should be aware of before investing here.
But note: Kumba Iron Ore may not be the best stock to buy. So take a peek at this free list of interesting companies with past earnings growth (and further growth forecast).
Please note, the market returns quoted in this article reflect the market weighted average returns of stocks that currently trade on South African exchanges.
Valuation is complex, but we're here to simplify it.
Discover if Kumba Iron Ore might be undervalued or overvalued with our detailed analysis, featuring fair value estimates, potential risks, dividends, insider trades, and its financial condition.
Access Free AnalysisHave feedback on this article? Concerned about the content? Get in touch with us directly. Alternatively, email editorial-team (at) simplywallst.com.
This article by Simply Wall St is general in nature. We provide commentary based on historical data and analyst forecasts only using an unbiased methodology and our articles are not intended to be financial advice. It does not constitute a recommendation to buy or sell any stock, and does not take account of your objectives, or your financial situation. We aim to bring you long-term focused analysis driven by fundamental data. Note that our analysis may not factor in the latest price-sensitive company announcements or qualitative material. Simply Wall St has no position in any stocks mentioned.
About JSE:KIO
Kumba Iron Ore
Engages in the exploration, extraction, beneficiation, marketing, sale, and shipping of iron ore for the steel industry primarily in South Africa, China, rest of Asia, Europe, the Middle East, and North Africa.
Outstanding track record with excellent balance sheet and pays a dividend.
