
Advertisement
What are the early trends we should look for to identify a stock that could multiply in value over the long term? Typically, we'll want to notice a trend of growing return on capital employed (ROCE) and alongside that, an expanding base of capital employed. Ultimately, this demonstrates that it's a business that is reinvesting profits at increasing rates of return. However, after briefly looking over the numbers, we don't think Netcare (JSE:NTC) has the makings of a multi-bagger going forward, but let's have a look at why that may be.
Return On Capital Employed (ROCE): What Is It?
For those who don't know, ROCE is a measure of a company's yearly pre-tax profit (its return), relative to the capital employed in the business. To calculate this metric for Netcare, this is the formula:
Return on Capital Employed = Earnings Before Interest and Tax (EBIT) ÷ (Total Assets - Current Liabilities)
0.13 = R2.8b ÷ (R28b - R5.6b) (Based on the trailing twelve months to September 2023).
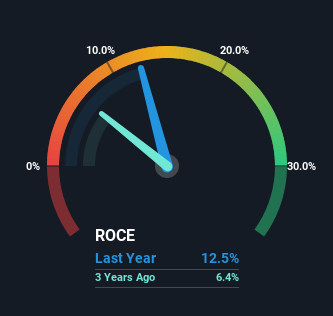
So, Netcare has an ROCE of 13%. By itself that's a normal return on capital and it's in line with the industry's average returns of 13%.
View our latest analysis for Netcare
In the above chart we have measured Netcare's prior ROCE against its prior performance, but the future is arguably more important. If you'd like, you can check out the forecasts from the analysts covering Netcare for free.
What Does the ROCE Trend For Netcare Tell Us?
On the surface, the trend of ROCE at Netcare doesn't inspire confidence. Over the last five years, returns on capital have decreased to 13% from 21% five years ago. However it looks like Netcare might be reinvesting for long term growth because while capital employed has increased, the company's sales haven't changed much in the last 12 months. It may take some time before the company starts to see any change in earnings from these investments.
In Conclusion...
Bringing it all together, while we're somewhat encouraged by Netcare's reinvestment in its own business, we're aware that returns are shrinking. And investors appear hesitant that the trends will pick up because the stock has fallen 41% in the last five years. Therefore based on the analysis done in this article, we don't think Netcare has the makings of a multi-bagger.
One more thing, we've spotted 2 warning signs facing Netcare that you might find interesting.
If you want to search for solid companies with great earnings, check out this free list of companies with good balance sheets and impressive returns on equity.
Valuation is complex, but we're here to simplify it.
Discover if Netcare might be undervalued or overvalued with our detailed analysis, featuring fair value estimates, potential risks, dividends, insider trades, and its financial condition.
Access Free AnalysisHave feedback on this article? Concerned about the content? Get in touch with us directly. Alternatively, email editorial-team (at) simplywallst.com.
This article by Simply Wall St is general in nature. We provide commentary based on historical data and analyst forecasts only using an unbiased methodology and our articles are not intended to be financial advice. It does not constitute a recommendation to buy or sell any stock, and does not take account of your objectives, or your financial situation. We aim to bring you long-term focused analysis driven by fundamental data. Note that our analysis may not factor in the latest price-sensitive company announcements or qualitative material. Simply Wall St has no position in any stocks mentioned.
About JSE:NTC
Netcare
An investment holding company, operates private hospitals in South Africa.
Good value with proven track record.
Similar Companies
Market Insights

Advertisement
Community Narratives
MINISO's fair value is projected at 26.69 with an anticipated PE ratio shift of 20x
Fair Value US$24.03|11.0% undervalued
BE
Community Contributor
Procter & Gamble: A Dividend Giant Facing Slowing Growth
Fair Value US$119.81|23.3% overvalued
AN
Community Contributor
Eli Lilly's Future Growth Driven by Tirzepatide and Favorable Market Conditions
Fair Value US$1.19k|13.8% undervalued
EA
Community Contributor