
Advertisement
- South Africa
- /
- Food
- /
- JSE:RFG
Reflecting on RFG Holdings' (JSE:RFG) Share Price Returns Over The Last Five Years

For many, the main point of investing is to generate higher returns than the overall market. But the main game is to find enough winners to more than offset the losers At this point some shareholders may be questioning their investment in RFG Holdings Limited (JSE:RFG), since the last five years saw the share price fall 49%. We also note that the stock has performed poorly over the last year, with the share price down 23%. It's up 1.1% in the last seven days.
View our latest analysis for RFG Holdings
In his essay The Superinvestors of Graham-and-Doddsville Warren Buffett described how share prices do not always rationally reflect the value of a business. One way to examine how market sentiment has changed over time is to look at the interaction between a company's share price and its earnings per share (EPS).
While the share price declined over five years, RFG Holdings actually managed to increase EPS by an average of 1.4% per year. So it doesn't seem like EPS is a great guide to understanding how the market is valuing the stock. Alternatively, growth expectations may have been unreasonable in the past.
Based on these numbers, we'd venture that the market may have been over-optimistic about forecast growth, half a decade ago. Having said that, we might get a better idea of what's going on with the stock by looking at other metrics.
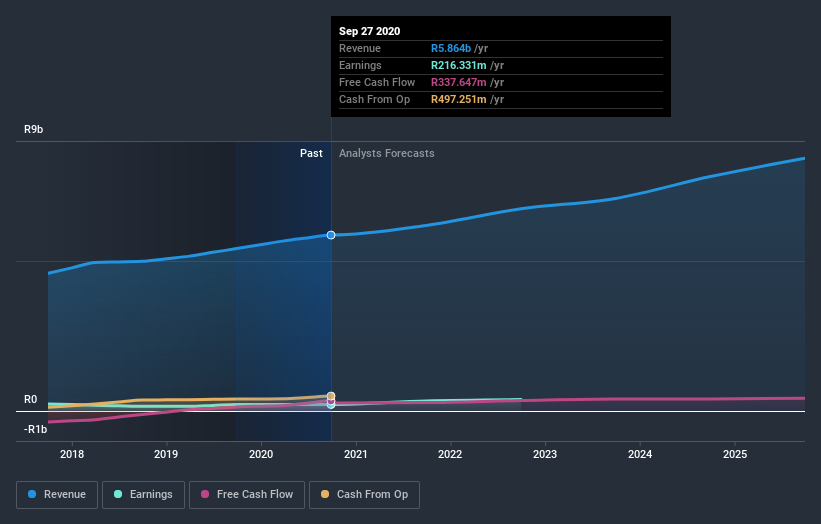
Revenue is actually up 11% over the time period. A more detailed examination of the revenue and earnings may or may not explain why the share price languishes; there could be an opportunity.
The company's revenue and earnings (over time) are depicted in the image below (click to see the exact numbers).
This free interactive report on RFG Holdings' balance sheet strength is a great place to start, if you want to investigate the stock further.
What About Dividends?
When looking at investment returns, it is important to consider the difference between total shareholder return (TSR) and share price return. Whereas the share price return only reflects the change in the share price, the TSR includes the value of dividends (assuming they were reinvested) and the benefit of any discounted capital raising or spin-off. So for companies that pay a generous dividend, the TSR is often a lot higher than the share price return. As it happens, RFG Holdings' TSR for the last 5 years was -46%, which exceeds the share price return mentioned earlier. And there's no prize for guessing that the dividend payments largely explain the divergence!
A Different Perspective
RFG Holdings shareholders are down 22% for the year (even including dividends), but the market itself is up 0.5%. However, keep in mind that even the best stocks will sometimes underperform the market over a twelve month period. Regrettably, last year's performance caps off a bad run, with the shareholders facing a total loss of 8% per year over five years. Generally speaking long term share price weakness can be a bad sign, though contrarian investors might want to research the stock in hope of a turnaround. Before spending more time on RFG Holdings it might be wise to click here to see if insiders have been buying or selling shares.
If you like to buy stocks alongside management, then you might just love this free list of companies. (Hint: insiders have been buying them).
Please note, the market returns quoted in this article reflect the market weighted average returns of stocks that currently trade on ZA exchanges.
If you decide to trade RFG Holdings, use the lowest-cost* platform that is rated #1 Overall by Barron’s, Interactive Brokers. Trade stocks, options, futures, forex, bonds and funds on 135 markets, all from a single integrated account. Promoted
New: AI Stock Screener & Alerts
Our new AI Stock Screener scans the market every day to uncover opportunities.
• Dividend Powerhouses (3%+ Yield)
• Undervalued Small Caps with Insider Buying
• High growth Tech and AI Companies
Or build your own from over 50 metrics.
This article by Simply Wall St is general in nature. It does not constitute a recommendation to buy or sell any stock, and does not take account of your objectives, or your financial situation. We aim to bring you long-term focused analysis driven by fundamental data. Note that our analysis may not factor in the latest price-sensitive company announcements or qualitative material. Simply Wall St has no position in any stocks mentioned.
*Interactive Brokers Rated Lowest Cost Broker by StockBrokers.com Annual Online Review 2020
Have feedback on this article? Concerned about the content? Get in touch with us directly. Alternatively, email editorial-team@simplywallst.com.
About JSE:RFG
RFG Holdings
Manufactures and markets convenience meal solutions in South Africa, the Kingdom of Eswatini, and internationally.
Very undervalued with flawless balance sheet and pays a dividend.
Similar Companies
Market Insights


Advertisement
Community Narratives
A case for TSXV:USA to reach USD $5.00 - $9.00 (CAD $7.30–$12.29) by 2029.
Fair Value CA$12.29|91.2% undervalued
AG
Community Contributor
DLocal's Future Growth Fueled by 35% Revenue and Profit Margin Boosts
Fair Value US$195.39|94.1% undervalued
WY
Community Contributor
Historically Cheap, but the Margin of Safety Is Still Thin
Fair Value SEK 232.58|12.7% undervalued
MA
Community Contributor