- South Africa
- /
- Food and Staples Retail
- /
- JSE:MSM
The Returns At Massmart Holdings (JSE:MSM) Provide Us With Signs Of What's To Come


Did you know there are some financial metrics that can provide clues of a potential multi-bagger? Firstly, we'd want to identify a growing return on capital employed (ROCE) and then alongside that, an ever-increasing base of capital employed. Put simply, these types of businesses are compounding machines, meaning they are continually reinvesting their earnings at ever-higher rates of return. However, after investigating Massmart Holdings (JSE:MSM), we don't think it's current trends fit the mold of a multi-bagger.
What is Return On Capital Employed (ROCE)?
Just to clarify if you're unsure, ROCE is a metric for evaluating how much pre-tax income (in percentage terms) a company earns on the capital invested in its business. Analysts use this formula to calculate it for Massmart Holdings:
Return on Capital Employed = Earnings Before Interest and Tax (EBIT) ÷ (Total Assets - Current Liabilities)
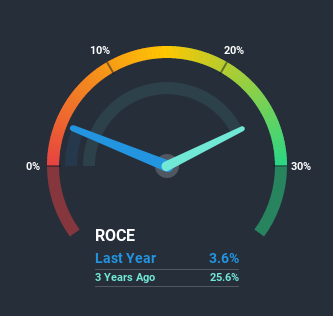
0.036 = R468m ÷ (R38b - R26b) (Based on the trailing twelve months to June 2020).
Therefore, Massmart Holdings has an ROCE of 3.6%. Ultimately, that's a low return and it under-performs the Consumer Retailing industry average of 15%.
Check out our latest analysis for Massmart Holdings
In the above chart we have measured Massmart Holdings' prior ROCE against its prior performance, but the future is arguably more important. If you'd like to see what analysts are forecasting going forward, you should check out our free report for Massmart Holdings.
What Can We Tell From Massmart Holdings' ROCE Trend?
On the surface, the trend of ROCE at Massmart Holdings doesn't inspire confidence. To be more specific, ROCE has fallen from 24% over the last five years. Meanwhile, the business is utilizing more capital but this hasn't moved the needle much in terms of sales in the past 12 months, so this could reflect longer term investments. It may take some time before the company starts to see any change in earnings from these investments.
On a separate but related note, it's important to know that Massmart Holdings has a current liabilities to total assets ratio of 67%, which we'd consider pretty high. This effectively means that suppliers (or short-term creditors) are funding a large portion of the business, so just be aware that this can introduce some elements of risk. While it's not necessarily a bad thing, it can be beneficial if this ratio is lower.
In Conclusion...
To conclude, we've found that Massmart Holdings is reinvesting in the business, but returns have been falling. Since the stock has declined 64% over the last five years, investors may not be too optimistic on this trend improving either. Therefore based on the analysis done in this article, we don't think Massmart Holdings has the makings of a multi-bagger.
On a final note, we've found 1 warning sign for Massmart Holdings that we think you should be aware of.
While Massmart Holdings may not currently earn the highest returns, we've compiled a list of companies that currently earn more than 25% return on equity. Check out this free list here.
If you decide to trade Massmart Holdings, use the lowest-cost* platform that is rated #1 Overall by Barron’s, Interactive Brokers. Trade stocks, options, futures, forex, bonds and funds on 135 markets, all from a single integrated account. Promoted
If you're looking to trade Massmart Holdings, open an account with the lowest-cost platform trusted by professionals, Interactive Brokers.
With clients in over 200 countries and territories, and access to 160 markets, IBKR lets you trade stocks, options, futures, forex, bonds and funds from a single integrated account.
Enjoy no hidden fees, no account minimums, and FX conversion rates as low as 0.03%, far better than what most brokers offer.
Sponsored ContentNew: Manage All Your Stock Portfolios in One Place
We've created the ultimate portfolio companion for stock investors, and it's free.
• Connect an unlimited number of Portfolios and see your total in one currency
• Be alerted to new Warning Signs or Risks via email or mobile
• Track the Fair Value of your stocks
This article by Simply Wall St is general in nature. It does not constitute a recommendation to buy or sell any stock, and does not take account of your objectives, or your financial situation. We aim to bring you long-term focused analysis driven by fundamental data. Note that our analysis may not factor in the latest price-sensitive company announcements or qualitative material. Simply Wall St has no position in any stocks mentioned.
*Interactive Brokers Rated Lowest Cost Broker by StockBrokers.com Annual Online Review 2020
Have feedback on this article? Concerned about the content? Get in touch with us directly. Alternatively, email editorial-team (at) simplywallst.com.
About JSE:MSM
Massmart Holdings
Massmart Holdings Limited operates as a retail and wholesale company in South Africa and the rest of Africa.
Slightly overvalued with worrying balance sheet.
Similar Companies
Market Insights

Community Narratives

