
Advertisement
- South Africa
- /
- Industrials
- /
- JSE:KAP
Shareholders 27% loss in KAP (JSE:KAP) partly attributable to the company's decline in earnings over past five years

KAP Limited (JSE:KAP) shareholders should be happy to see the share price up 20% in the last quarter. But if you look at the last five years the returns have not been good. After all, the share price is down 37% in that time, significantly under-performing the market.
Although the past week has been more reassuring for shareholders, they're still in the red over the last five years, so let's see if the underlying business has been responsible for the decline.
View our latest analysis for KAP
While markets are a powerful pricing mechanism, share prices reflect investor sentiment, not just underlying business performance. One way to examine how market sentiment has changed over time is to look at the interaction between a company's share price and its earnings per share (EPS).
KAP became profitable within the last five years. Most would consider that to be a good thing, so it's counter-intuitive to see the share price declining. Other metrics may better explain the share price move.
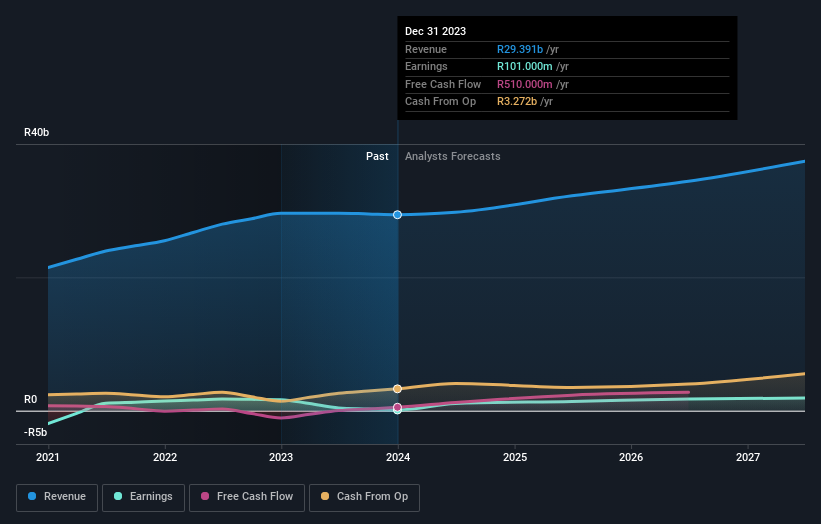
Revenue is actually up 5.3% over the time period. So it seems one might have to take closer look at the fundamentals to understand why the share price languishes. After all, there may be an opportunity.
You can see how earnings and revenue have changed over time in the image below (click on the chart to see the exact values).
You can see how its balance sheet has strengthened (or weakened) over time in this free interactive graphic.
What About The Total Shareholder Return (TSR)?
Investors should note that there's a difference between KAP's total shareholder return (TSR) and its share price change, which we've covered above. Arguably the TSR is a more complete return calculation because it accounts for the value of dividends (as if they were reinvested), along with the hypothetical value of any discounted capital that have been offered to shareholders. KAP's TSR of was a loss of 27% for the 5 years. That wasn't as bad as its share price return, because it has paid dividends.
A Different Perspective
It's good to see that KAP has rewarded shareholders with a total shareholder return of 27% in the last twelve months. Notably the five-year annualised TSR loss of 5% per year compares very unfavourably with the recent share price performance. We generally put more weight on the long term performance over the short term, but the recent improvement could hint at a (positive) inflection point within the business. I find it very interesting to look at share price over the long term as a proxy for business performance. But to truly gain insight, we need to consider other information, too. Case in point: We've spotted 4 warning signs for KAP you should be aware of, and 1 of them is significant.
If you would prefer to check out another company -- one with potentially superior financials -- then do not miss this free list of companies that have proven they can grow earnings.
Please note, the market returns quoted in this article reflect the market weighted average returns of stocks that currently trade on South African exchanges.
Valuation is complex, but we're here to simplify it.
Discover if KAP might be undervalued or overvalued with our detailed analysis, featuring fair value estimates, potential risks, dividends, insider trades, and its financial condition.
Access Free AnalysisHave feedback on this article? Concerned about the content? Get in touch with us directly. Alternatively, email editorial-team (at) simplywallst.com.
This article by Simply Wall St is general in nature. We provide commentary based on historical data and analyst forecasts only using an unbiased methodology and our articles are not intended to be financial advice. It does not constitute a recommendation to buy or sell any stock, and does not take account of your objectives, or your financial situation. We aim to bring you long-term focused analysis driven by fundamental data. Note that our analysis may not factor in the latest price-sensitive company announcements or qualitative material. Simply Wall St has no position in any stocks mentioned.
About JSE:KAP
KAP
Engages in industrial, chemical, and logistics businesses in South Africa, rest of Africa, the Americas, Europe, the Middle East, and Australasia.
Very undervalued with reasonable growth potential.
Similar Companies
Market Insights

Advertisement
Community Narratives
Pinterest will surge as advertising innovations ignite revenue growth
Fair Value US$42.63|27.1% undervalued
BR
Community Contributor
Brambles' Revenue Set to Climb 14% with Profit Margins Following
Fair Value AU$21.90|5.9% overvalued
RO
Community Contributor
Challenging Future for STG as Organic Sales Decline by 8.8%
Fair Value DKK 116.13|26.8% undervalued
KA
Community Contributor