
Advertisement
- United States
- /
- Gas Utilities
- /
- NYSE:CPK
Investors in Chesapeake Utilities (NYSE:CPK) have seen notable returns of 44% over the past five years

If you buy and hold a stock for many years, you'd hope to be making a profit. Furthermore, you'd generally like to see the share price rise faster than the market. But Chesapeake Utilities Corporation (NYSE:CPK) has fallen short of that second goal, with a share price rise of 31% over five years, which is below the market return. Looking at the last year alone, the stock is up 18%.
So let's investigate and see if the longer term performance of the company has been in line with the underlying business' progress.
View our latest analysis for Chesapeake Utilities
In his essay The Superinvestors of Graham-and-Doddsville Warren Buffett described how share prices do not always rationally reflect the value of a business. One way to examine how market sentiment has changed over time is to look at the interaction between a company's share price and its earnings per share (EPS).
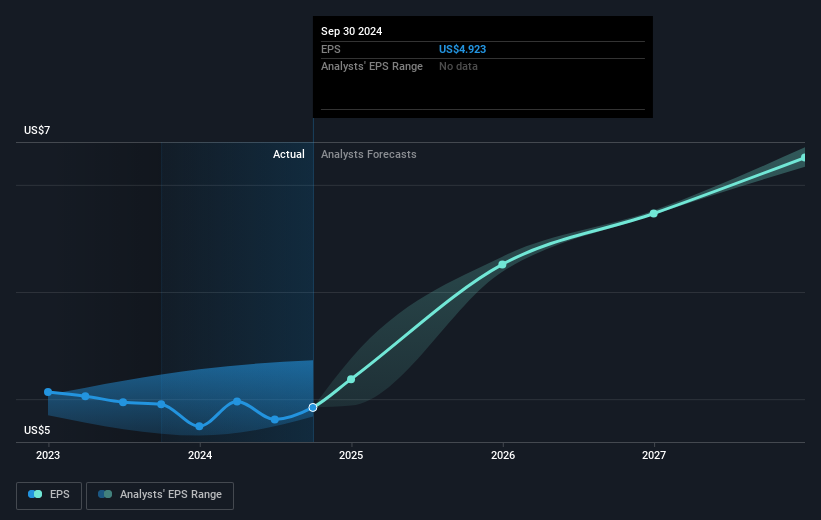
During five years of share price growth, Chesapeake Utilities achieved compound earnings per share (EPS) growth of 4.5% per year. So the EPS growth rate is rather close to the annualized share price gain of 6% per year. That suggests that the market sentiment around the company hasn't changed much over that time. Indeed, it would appear the share price is reacting to the EPS.
The image below shows how EPS has tracked over time (if you click on the image you can see greater detail).
It's probably worth noting that the CEO is paid less than the median at similar sized companies. But while CEO remuneration is always worth checking, the really important question is whether the company can grow earnings going forward. Dive deeper into the earnings by checking this interactive graph of Chesapeake Utilities' earnings, revenue and cash flow.
What About Dividends?
As well as measuring the share price return, investors should also consider the total shareholder return (TSR). The TSR is a return calculation that accounts for the value of cash dividends (assuming that any dividend received was reinvested) and the calculated value of any discounted capital raisings and spin-offs. So for companies that pay a generous dividend, the TSR is often a lot higher than the share price return. In the case of Chesapeake Utilities, it has a TSR of 44% for the last 5 years. That exceeds its share price return that we previously mentioned. This is largely a result of its dividend payments!
A Different Perspective
Chesapeake Utilities shareholders gained a total return of 20% during the year. But that was short of the market average. The silver lining is that the gain was actually better than the average annual return of 8% per year over five year. It is possible that returns will improve along with the business fundamentals. It's always interesting to track share price performance over the longer term. But to understand Chesapeake Utilities better, we need to consider many other factors. Like risks, for instance. Every company has them, and we've spotted 2 warning signs for Chesapeake Utilities (of which 1 is potentially serious!) you should know about.
If you would prefer to check out another company -- one with potentially superior financials -- then do not miss this free list of companies that have proven they can grow earnings.
Please note, the market returns quoted in this article reflect the market weighted average returns of stocks that currently trade on American exchanges.
New: AI Stock Screener & Alerts
Our new AI Stock Screener scans the market every day to uncover opportunities.
• Dividend Powerhouses (3%+ Yield)
• Undervalued Small Caps with Insider Buying
• High growth Tech and AI Companies
Or build your own from over 50 metrics.
Have feedback on this article? Concerned about the content? Get in touch with us directly. Alternatively, email editorial-team (at) simplywallst.com.
This article by Simply Wall St is general in nature. We provide commentary based on historical data and analyst forecasts only using an unbiased methodology and our articles are not intended to be financial advice. It does not constitute a recommendation to buy or sell any stock, and does not take account of your objectives, or your financial situation. We aim to bring you long-term focused analysis driven by fundamental data. Note that our analysis may not factor in the latest price-sensitive company announcements or qualitative material. Simply Wall St has no position in any stocks mentioned.
About NYSE:CPK
Chesapeake Utilities
Operates as an energy delivery company in the United States.
Solid track record average dividend payer.
Similar Companies
Market Insights


Advertisement
Community Narratives
Alphabet: The Under-appreciated Compounder Hiding in Plain Sight
Fair Value US$282.83|32.8% undervalued
BL
Community Contributor
Planet Labs: At The Heart Of The Emerging New Space Boom
Fair Value US$11.31|45.4% undervalued
AN
Community Contributor
Exxon in Guyana 5 year forecast Low $135 to High $189
Fair Value US$174.00|37.0% undervalued
AG
Community Contributor