
Advertisement
- United States
- /
- Electric Utilities
- /
- NasdaqGS:XEL
Here's What Xcel Energy Inc.'s (NASDAQ:XEL) P/E Is Telling Us

This article is written for those who want to get better at using price to earnings ratios (P/E ratios). We'll show how you can use Xcel Energy Inc.'s (NASDAQ:XEL) P/E ratio to inform your assessment of the investment opportunity. Based on the last twelve months, Xcel Energy's P/E ratio is 22.56. In other words, at today's prices, investors are paying $22.56 for every $1 in prior year profit.
Check out our latest analysis for Xcel Energy
How Do I Calculate Xcel Energy's Price To Earnings Ratio?
The formula for P/E is:
Price to Earnings Ratio = Share Price ÷ Earnings per Share (EPS)
Or for Xcel Energy:
P/E of 22.56 = $55.67 ÷ $2.47 (Based on the trailing twelve months to December 2018.)
Is A High Price-to-Earnings Ratio Good?
A higher P/E ratio implies that investors pay a higher price for the earning power of the business. That isn't necessarily good or bad, but a high P/E implies relatively high expectations of what a company can achieve in the future.
How Growth Rates Impact P/E Ratios
Generally speaking the rate of earnings growth has a profound impact on a company's P/E multiple. When earnings grow, the 'E' increases, over time. That means unless the share price increases, the P/E will reduce in a few years. Then, a lower P/E should attract more buyers, pushing the share price up.
Xcel Energy saw earnings per share improve by -9.4% last year. And earnings per share have improved by 5.2% annually, over the last five years.
Does Xcel Energy Have A Relatively High Or Low P/E For Its Industry?
The P/E ratio essentially measures market expectations of a company. The image below shows that Xcel Energy has a P/E ratio that is roughly in line with the electric utilities industry average (22.1).
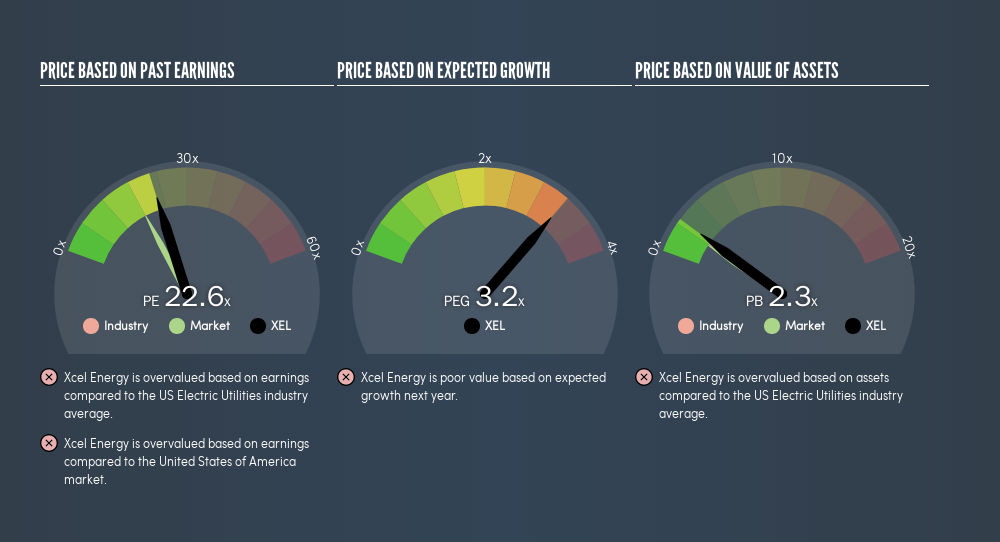
Xcel Energy's P/E tells us that market participants think its prospects are roughly in line with its industry. So if Xcel Energy actually outperforms its peers going forward, that should be a positive for the share price. Further research into factors such asmanagement tenure, could help you form your own view on whether that is likely.
Don't Forget: The P/E Does Not Account For Debt or Bank Deposits
The 'Price' in P/E reflects the market capitalization of the company. That means it doesn't take debt or cash into account. The exact same company would hypothetically deserve a higher P/E ratio if it had a strong balance sheet, than if it had a weak one with lots of debt, because a cashed up company can spend on growth.
Spending on growth might be good or bad a few years later, but the point is that the P/E ratio does not account for the option (or lack thereof).
So What Does Xcel Energy's Balance Sheet Tell Us?
Xcel Energy has net debt worth 59% of its market capitalization. If you want to compare its P/E ratio to other companies, you should absolutely keep in mind it has significant borrowings.
The Bottom Line On Xcel Energy's P/E Ratio
Xcel Energy trades on a P/E ratio of 22.6, which is above the US market average of 18.1. With meaningful debt and only modest recent earnings growth, the market is either expecting reliable long-term growth, or a near-term improvement.
When the market is wrong about a stock, it gives savvy investors an opportunity. As value investor Benjamin Graham famously said, 'In the short run, the market is a voting machine but in the long run, it is a weighing machine.' So this freevisualization of the analyst consensus on future earnings could help you make the right decision about whether to buy, sell, or hold.
You might be able to find a better buy than Xcel Energy. If you want a selection of possible winners, check out this freelist of interesting companies that trade on a P/E below 20 (but have proven they can grow earnings).
We aim to bring you long-term focused research analysis driven by fundamental data. Note that our analysis may not factor in the latest price-sensitive company announcements or qualitative material.
If you spot an error that warrants correction, please contact the editor at editorial-team@simplywallst.com. This article by Simply Wall St is general in nature. It does not constitute a recommendation to buy or sell any stock, and does not take account of your objectives, or your financial situation. Simply Wall St has no position in the stocks mentioned. Thank you for reading.
About NasdaqGS:XEL
Xcel Energy
Through its subsidiaries, engages in the generation, purchasing, transmission, distribution, and sale of electricity in the United States.
Average dividend payer with acceptable track record.
Similar Companies
Market Insights


Advertisement
Community Narratives
For the Emperor: Why Games Workshop Could Be a Star Investment
Fair Value UK£160.00|0.4% overvalued
RO
Community Contributor
Securitas will boost margins with AI and tech-driven services
Fair Value SEK 260.91|44.5% undervalued
UN
Community Contributor
A Leader in EV Charging with Growth Potential
Fair Value €27.00|17.8% undervalued
TI
Community Contributor