
Advertisement

Some say volatility, rather than debt, is the best way to think about risk as an investor, but Warren Buffett famously said that 'Volatility is far from synonymous with risk.' When we think about how risky a company is, we always like to look at its use of debt, since debt overload can lead to ruin. We note that SkyWest, Inc. (NASDAQ:SKYW) does have debt on its balance sheet. But the real question is whether this debt is making the company risky.
Why Does Debt Bring Risk?
Debt and other liabilities become risky for a business when it cannot easily fulfill those obligations, either with free cash flow or by raising capital at an attractive price. Part and parcel of capitalism is the process of 'creative destruction' where failed businesses are mercilessly liquidated by their bankers. While that is not too common, we often do see indebted companies permanently diluting shareholders because lenders force them to raise capital at a distressed price. Having said that, the most common situation is where a company manages its debt reasonably well - and to its own advantage. The first step when considering a company's debt levels is to consider its cash and debt together.
Check out our latest analysis for SkyWest
What Is SkyWest's Net Debt?
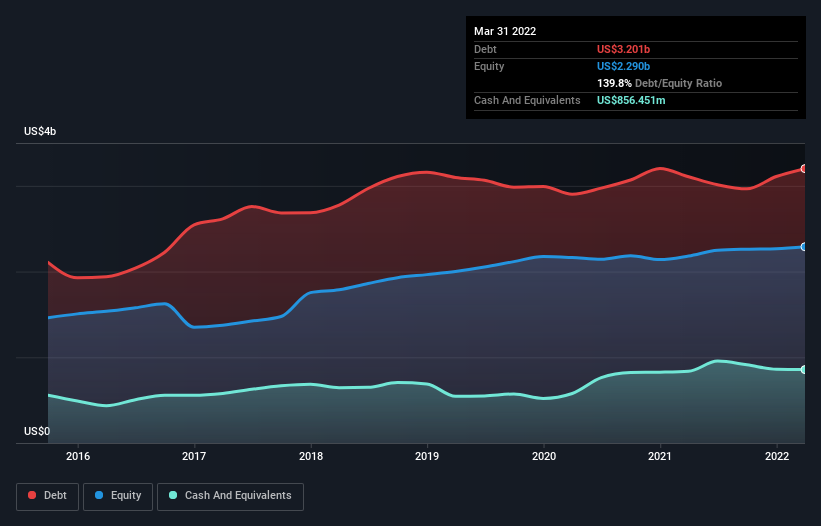
The chart below, which you can click on for greater detail, shows that SkyWest had US$3.20b in debt in March 2022; about the same as the year before. However, because it has a cash reserve of US$856.5m, its net debt is less, at about US$2.34b.
A Look At SkyWest's Liabilities
The latest balance sheet data shows that SkyWest had liabilities of US$1.14b due within a year, and liabilities of US$3.72b falling due after that. On the other hand, it had cash of US$856.5m and US$68.0m worth of receivables due within a year. So its liabilities total US$3.93b more than the combination of its cash and short-term receivables.
The deficiency here weighs heavily on the US$1.05b company itself, as if a child were struggling under the weight of an enormous back-pack full of books, his sports gear, and a trumpet. So we'd watch its balance sheet closely, without a doubt. At the end of the day, SkyWest would probably need a major re-capitalization if its creditors were to demand repayment.
In order to size up a company's debt relative to its earnings, we calculate its net debt divided by its earnings before interest, tax, depreciation, and amortization (EBITDA) and its earnings before interest and tax (EBIT) divided by its interest expense (its interest cover). This way, we consider both the absolute quantum of the debt, as well as the interest rates paid on it.
While we wouldn't worry about SkyWest's net debt to EBITDA ratio of 4.4, we think its super-low interest cover of 0.86 times is a sign of high leverage. It seems that the business incurs large depreciation and amortisation charges, so maybe its debt load is heavier than it would first appear, since EBITDA is arguably a generous measure of earnings. So shareholders should probably be aware that interest expenses appear to have really impacted the business lately. One redeeming factor for SkyWest is that it turned last year's EBIT loss into a gain of US$102m, over the last twelve months. The balance sheet is clearly the area to focus on when you are analysing debt. But it is future earnings, more than anything, that will determine SkyWest's ability to maintain a healthy balance sheet going forward. So if you want to see what the professionals think, you might find this free report on analyst profit forecasts to be interesting.
Finally, a business needs free cash flow to pay off debt; accounting profits just don't cut it. So it's worth checking how much of the earnings before interest and tax (EBIT) is backed by free cash flow. Over the last year, SkyWest saw substantial negative free cash flow, in total. While investors are no doubt expecting a reversal of that situation in due course, it clearly does mean its use of debt is more risky.
Our View
To be frank both SkyWest's conversion of EBIT to free cash flow and its track record of staying on top of its total liabilities make us rather uncomfortable with its debt levels. Having said that, its ability to grow its EBIT isn't such a worry. Taking into account all the aforementioned factors, it looks like SkyWest has too much debt. While some investors love that sort of risky play, it's certainly not our cup of tea. The balance sheet is clearly the area to focus on when you are analysing debt. But ultimately, every company can contain risks that exist outside of the balance sheet. We've identified 2 warning signs with SkyWest (at least 1 which shouldn't be ignored) , and understanding them should be part of your investment process.
If, after all that, you're more interested in a fast growing company with a rock-solid balance sheet, then check out our list of net cash growth stocks without delay.
New: Manage All Your Stock Portfolios in One Place
We've created the ultimate portfolio companion for stock investors, and it's free.
• Connect an unlimited number of Portfolios and see your total in one currency
• Be alerted to new Warning Signs or Risks via email or mobile
• Track the Fair Value of your stocks
Have feedback on this article? Concerned about the content? Get in touch with us directly. Alternatively, email editorial-team (at) simplywallst.com.
This article by Simply Wall St is general in nature. We provide commentary based on historical data and analyst forecasts only using an unbiased methodology and our articles are not intended to be financial advice. It does not constitute a recommendation to buy or sell any stock, and does not take account of your objectives, or your financial situation. We aim to bring you long-term focused analysis driven by fundamental data. Note that our analysis may not factor in the latest price-sensitive company announcements or qualitative material. Simply Wall St has no position in any stocks mentioned.
About NasdaqGS:SKYW
SkyWest
Through its subsidiaries, engages in the operation of a regional airline in the United States.
Solid track record and fair value.
Similar Companies
Market Insights


Advertisement
Community Narratives
For the Emperor: Why Games Workshop Could Be a Star Investment
Fair Value UK£160.00|0.4% undervalued
RO
Community Contributor
Securitas will boost margins with AI and tech-driven services
Fair Value SEK 260.91|45.0% undervalued
UN
Community Contributor
A Leader in EV Charging with Growth Potential
Fair Value €27.00|20.4% undervalued
TI
Community Contributor