
Advertisement
- United States
- /
- Marine and Shipping
- /
- NasdaqCM:SHIP
Calculating The Fair Value Of Seanergy Maritime Holdings Corp. (NASDAQ:SHIP)
Key Insights
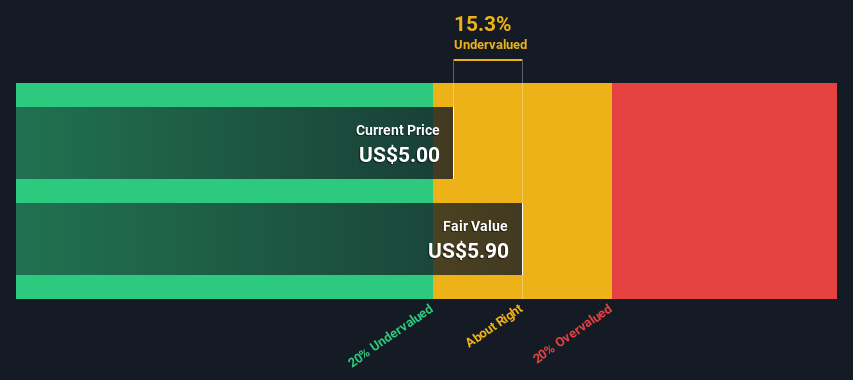
- Using the 2 Stage Free Cash Flow to Equity, Seanergy Maritime Holdings fair value estimate is US$5.90
- With US$5.00 share price, Seanergy Maritime Holdings appears to be trading close to its estimated fair value
- Our fair value estimate is 45% lower than Seanergy Maritime Holdings' analyst price target of US$10.67
Does the May share price for Seanergy Maritime Holdings Corp. (NASDAQ:SHIP) reflect what it's really worth? Today, we will estimate the stock's intrinsic value by estimating the company's future cash flows and discounting them to their present value. This will be done using the Discounted Cash Flow (DCF) model. Believe it or not, it's not too difficult to follow, as you'll see from our example!
Remember though, that there are many ways to estimate a company's value, and a DCF is just one method. For those who are keen learners of equity analysis, the Simply Wall St analysis model here may be something of interest to you.
View our latest analysis for Seanergy Maritime Holdings
The Model
We are going to use a two-stage DCF model, which, as the name states, takes into account two stages of growth. The first stage is generally a higher growth period which levels off heading towards the terminal value, captured in the second 'steady growth' period. In the first stage we need to estimate the cash flows to the business over the next ten years. Where possible we use analyst estimates, but when these aren't available we extrapolate the previous free cash flow (FCF) from the last estimate or reported value. We assume companies with shrinking free cash flow will slow their rate of shrinkage, and that companies with growing free cash flow will see their growth rate slow, over this period. We do this to reflect that growth tends to slow more in the early years than it does in later years.
Generally we assume that a dollar today is more valuable than a dollar in the future, so we discount the value of these future cash flows to their estimated value in today's dollars:
10-year free cash flow (FCF) estimate
| 2023 | 2024 | 2025 | 2026 | 2027 | 2028 | 2029 | 2030 | 2031 | 2032 | |
| Levered FCF ($, Millions) | US$94.3m | US$35.7m | US$15.2m | US$9.23m | US$6.73m | US$5.50m | US$4.84m | US$4.45m | US$4.24m | US$4.12m |
| Growth Rate Estimate Source | Analyst x1 | Analyst x2 | Est @ -57.30% | Est @ -39.48% | Est @ -27.00% | Est @ -18.27% | Est @ -12.15% | Est @ -7.88% | Est @ -4.88% | Est @ -2.78% |
| Present Value ($, Millions) Discounted @ 25% | US$75.4 | US$22.8 | US$7.8 | US$3.8 | US$2.2 | US$1.4 | US$1.0 | US$0.7 | US$0.6 | US$0.4 |
("Est" = FCF growth rate estimated by Simply Wall St)
Present Value of 10-year Cash Flow (PVCF) = US$116m
After calculating the present value of future cash flows in the initial 10-year period, we need to calculate the Terminal Value, which accounts for all future cash flows beyond the first stage. The Gordon Growth formula is used to calculate Terminal Value at a future annual growth rate equal to the 5-year average of the 10-year government bond yield of 2.1%. We discount the terminal cash flows to today's value at a cost of equity of 25%.
Terminal Value (TV)= FCF2032 × (1 + g) ÷ (r – g) = US$4.1m× (1 + 2.1%) ÷ (25%– 2.1%) = US$18m
Present Value of Terminal Value (PVTV)= TV / (1 + r)10= US$18m÷ ( 1 + 25%)10= US$2.0m
The total value, or equity value, is then the sum of the present value of the future cash flows, which in this case is US$118m. To get the intrinsic value per share, we divide this by the total number of shares outstanding. Compared to the current share price of US$5.0, the company appears about fair value at a 15% discount to where the stock price trades currently. The assumptions in any calculation have a big impact on the valuation, so it is better to view this as a rough estimate, not precise down to the last cent.
Important Assumptions
The calculation above is very dependent on two assumptions. The first is the discount rate and the other is the cash flows. If you don't agree with these result, have a go at the calculation yourself and play with the assumptions. The DCF also does not consider the possible cyclicality of an industry, or a company's future capital requirements, so it does not give a full picture of a company's potential performance. Given that we are looking at Seanergy Maritime Holdings as potential shareholders, the cost of equity is used as the discount rate, rather than the cost of capital (or weighted average cost of capital, WACC) which accounts for debt. In this calculation we've used 25%, which is based on a levered beta of 1.891. Beta is a measure of a stock's volatility, compared to the market as a whole. We get our beta from the industry average beta of globally comparable companies, with an imposed limit between 0.8 and 2.0, which is a reasonable range for a stable business.
SWOT Analysis for Seanergy Maritime Holdings
Strength
- Debt is well covered by cash flow.
Weakness
- Earnings declined over the past year.
- Interest payments on debt are not well covered.
- Dividend is low compared to the top 25% of dividend payers in the Shipping market.
- Shareholders have been diluted in the past year.
Opportunity
- Current share price is below our estimate of fair value.
- Significant insider buying over the past 3 months.
Threat
- Paying a dividend but company has no free cash flows.
- Annual earnings are forecast to decline for the next 2 years.
Next Steps:
Valuation is only one side of the coin in terms of building your investment thesis, and it is only one of many factors that you need to assess for a company. DCF models are not the be-all and end-all of investment valuation. Instead the best use for a DCF model is to test certain assumptions and theories to see if they would lead to the company being undervalued or overvalued. For example, changes in the company's cost of equity or the risk free rate can significantly impact the valuation. For Seanergy Maritime Holdings, there are three important factors you should further examine:
- Risks: Be aware that Seanergy Maritime Holdings is showing 5 warning signs in our investment analysis , and 2 of those make us uncomfortable...
- Future Earnings: How does SHIP's growth rate compare to its peers and the wider market? Dig deeper into the analyst consensus number for the upcoming years by interacting with our free analyst growth expectation chart.
- Other High Quality Alternatives: Do you like a good all-rounder? Explore our interactive list of high quality stocks to get an idea of what else is out there you may be missing!
PS. The Simply Wall St app conducts a discounted cash flow valuation for every stock on the NASDAQCM every day. If you want to find the calculation for other stocks just search here.
New: Manage All Your Stock Portfolios in One Place
We've created the ultimate portfolio companion for stock investors, and it's free.
• Connect an unlimited number of Portfolios and see your total in one currency
• Be alerted to new Warning Signs or Risks via email or mobile
• Track the Fair Value of your stocks
Have feedback on this article? Concerned about the content? Get in touch with us directly. Alternatively, email editorial-team (at) simplywallst.com.
This article by Simply Wall St is general in nature. We provide commentary based on historical data and analyst forecasts only using an unbiased methodology and our articles are not intended to be financial advice. It does not constitute a recommendation to buy or sell any stock, and does not take account of your objectives, or your financial situation. We aim to bring you long-term focused analysis driven by fundamental data. Note that our analysis may not factor in the latest price-sensitive company announcements or qualitative material. Simply Wall St has no position in any stocks mentioned.
About NasdaqCM:SHIP
Seanergy Maritime Holdings
A shipping company, engages in the seaborne transportation of dry bulk commodities worldwide.
Undervalued with moderate growth potential.
Similar Companies
Market Insights

Advertisement
Community Narratives
Finding The True Value Of A Logistics Powerhouse
Fair Value US$95.21|8.5% undervalued
NV
Community Contributor
Paradigm Biopharmaceuticals Will Lead Osteoarthritis Treatment with Zilosul's FDA Success
Fair Value AU$5.50|91.9% undervalued
AM
Community Contributor
Barrick Mining (ABX:CA): A Gold Hedge against a U.S. Shutdown
Fair Value CA$60.00|26.5% undervalued
GM
Community Contributor