Advertisement
- United States
- /
- Transportation
- /
- NasdaqGS:SAIA
Is Saia's Slumping Share Price Creating a Fresh Opportunity for Investors in 2025?

Simply Wall St
Reviewed by Bailey Pemberton
- Ever wonder if Saia's stock is priced right or if you could be missing out on real value? Let’s dig in together and get clarity on what the numbers really mean for you as an investor.
- Saia's share price has taken a hit recently, tumbling 10.3% this past week and losing 37.7% year-to-date. This can either signal a timely value opportunity or point to shifting risks in the business.
- Much of this recent volatility has been linked to broader industry headwinds and mounting concerns about freight demand. Competitive dynamics are also impacting transportation stocks. Headlines around supply chain pressures and heightened operating costs have kept traders and analysts on their toes.
- On the valuation front, Saia scores a solid 5 out of 6 on our valuation checks, putting it ahead of many sector peers. We will walk through each valuation lens, but keep reading for a fresh way to put these numbers in context at the end of the article.
Find out why Saia's -43.5% return over the last year is lagging behind its peers.
Approach 1: Saia Discounted Cash Flow (DCF) Analysis
The Discounted Cash Flow (DCF) model estimates a company’s value by projecting its future cash flows and discounting them back to today’s dollars. This provides a perspective on what the business may be worth based on its ability to generate cash in the years ahead.
Saia’s current Free Cash Flow (FCF) stands at -$112.08 Million, reflecting a period of reinvestment or challenges over the last twelve months. According to analyst forecasts, the company’s FCF is projected to improve substantially. By 2029, estimates suggest FCF could reach $227 Million. These forecasts are informed by analyst expectations for the next five years, with further projections extrapolated to the ten-year mark.
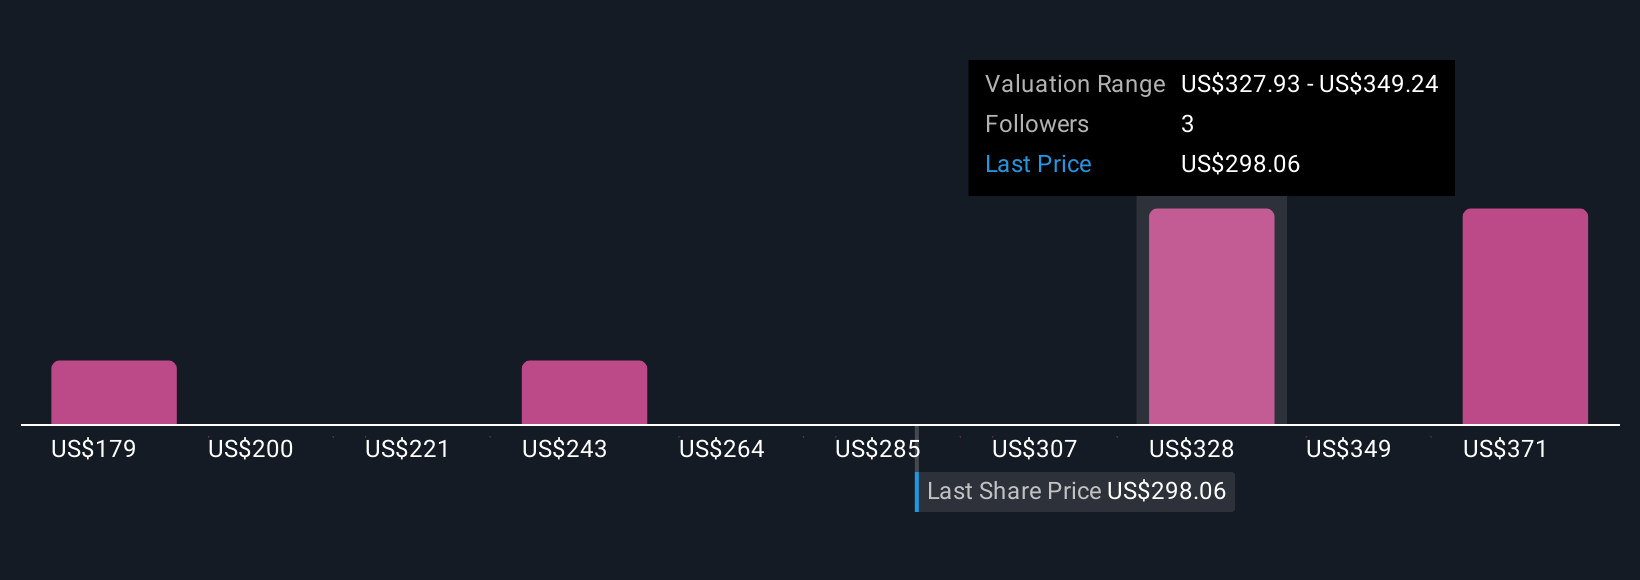
Based on this two-stage DCF analysis, the estimated intrinsic value for Saia comes out to $391.08 per share. This represents a discount of 29.1% compared to the current share price, which may signal meaningful undervaluation.
Result: UNDERVALUED
Our Discounted Cash Flow (DCF) analysis suggests Saia is undervalued by 29.1%. Track this in your watchlist or portfolio, or discover 856 more undervalued stocks based on cash flows.

Approach 2: Saia Price vs Earnings
The Price-to-Earnings (PE) ratio is often considered a key metric for valuing profitable companies, as it measures how much investors are willing to pay today for a dollar of current earnings. For investors trying to gauge if Saia is attractively priced, the PE ratio provides a straightforward, apples-to-apples comparison across companies of various sizes within the same industry.
What constitutes a “normal” or fair PE ratio depends on a company’s growth prospects and risk profile. When a business is growing quickly or is perceived as less risky, the market tends to assign it a higher PE to reflect the potential for future earnings increases. In contrast, companies facing slower growth or more uncertainty generally trade at lower PE multiples.
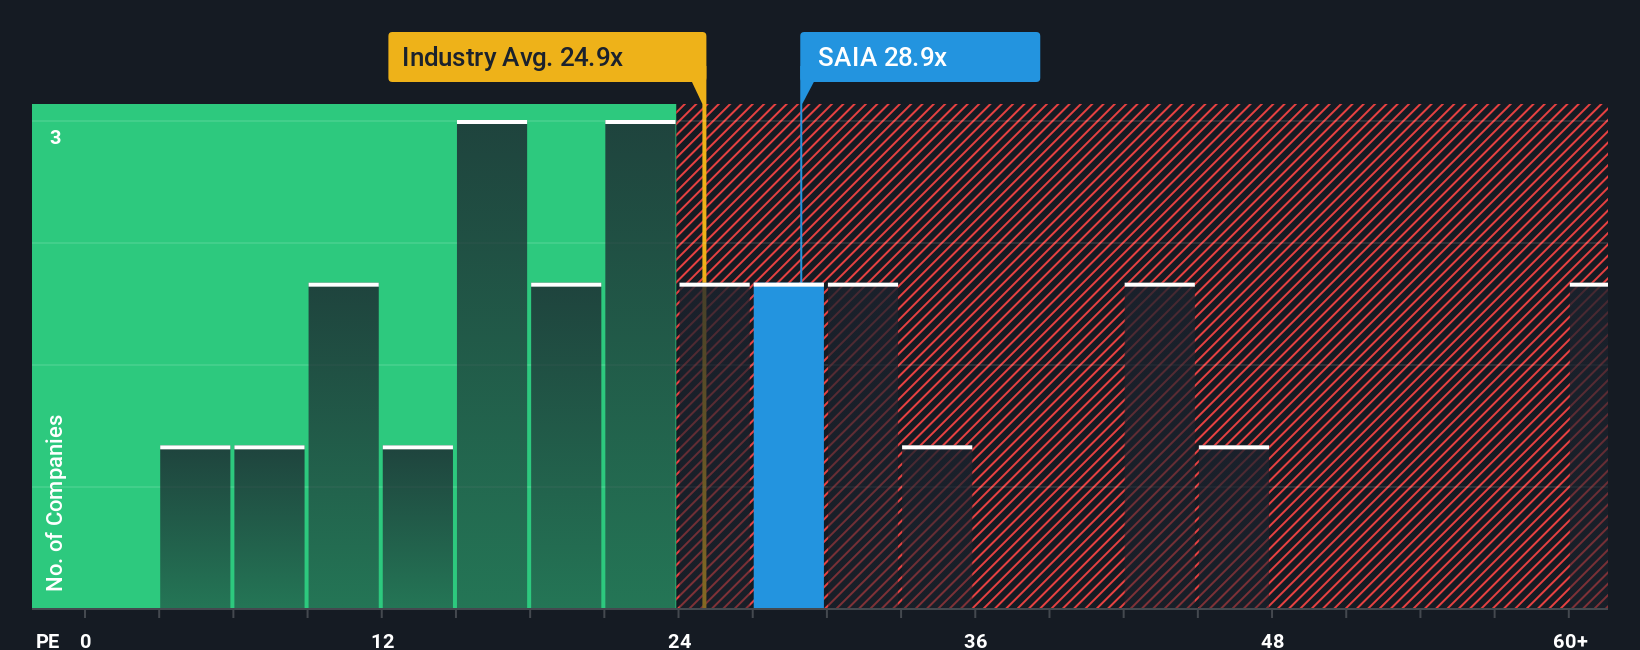
Currently, Saia trades at a PE of 25x. This is very close to the transportation industry average of 25.8x, but below the average of its closest sector peers at 35.1x. However, Simply Wall St's “Fair Ratio” model estimates Saia’s fair PE should be 14x, factoring in the company’s specific earnings growth outlook, risk, profit margins, industry, and market cap.
The Fair Ratio goes deeper than the usual industry or peer benchmarks, offering a more tailored view that reflects what a reasonable multiple should be for Saia’s unique circumstances, rather than just how it compares to others. This approach is especially useful for investors who want a valuation picture that is not distorted by outlier companies or short-term swings in sector sentiment.
Since Saia’s current PE (25x) is well above its Fair Ratio (14x), the stock appears to be overvalued based on this metric.
Result: OVERVALUED
PE ratios tell one story, but what if the real opportunity lies elsewhere? Discover 1405 companies where insiders are betting big on explosive growth.
Upgrade Your Decision Making: Choose your Saia Narrative
Earlier we mentioned that there's an even better way to understand valuation, so let's introduce you to Narratives. A Narrative is your story behind the stock, a structured way to think through what you believe about Saia’s business and future, connecting your perspective to clear numbers like projected revenue, earnings, and margins to arrive at your own fair value.
Instead of just following a single metric, building a Narrative allows you to link the company’s outlook (what’s happening in its network, competitive positioning, or industry) directly to a financial forecast and a fair price. This way, your investing decisions are rooted in your true expectations. Narratives on Simply Wall St's Community page make this process easy and interactive, giving millions of investors tools to map out scenarios and compare their view against others. Most importantly, you can instantly see when updated news or earnings releases move the numbers.
By comparing your Fair Value to the current market price, Narratives help you decide when a stock is a true opportunity or if caution is warranted, while letting you update your assumptions as new information arrives. For example, some Saia investors may see significant cost efficiencies driving $405 in fair value, while others anticipate weaker demand and arrive at a $250 target. This shows how Narratives capture each investor’s logic and outlook in a way numbers alone never could.
Do you think there's more to the story for Saia? Head over to our Community to see what others are saying!
This article by Simply Wall St is general in nature. We provide commentary based on historical data and analyst forecasts only using an unbiased methodology and our articles are not intended to be financial advice. It does not constitute a recommendation to buy or sell any stock, and does not take account of your objectives, or your financial situation. We aim to bring you long-term focused analysis driven by fundamental data. Note that our analysis may not factor in the latest price-sensitive company announcements or qualitative material. Simply Wall St has no position in any stocks mentioned.
New: Manage All Your Stock Portfolios in One Place
We've created the ultimate portfolio companion for stock investors, and it's free.
• Connect an unlimited number of Portfolios and see your total in one currency
• Be alerted to new Warning Signs or Risks via email or mobile
• Track the Fair Value of your stocks
Have feedback on this article? Concerned about the content? Get in touch with us directly. Alternatively, email editorial-team@simplywallst.com
About NasdaqGS:SAIA
Undervalued with adequate balance sheet.
Market Insights

Advertisement
Community Narratives
The company that turned a verb into a global necessity and basically runs the modern internet, digital ads, smartphones, maps, and AI.
Fair Value US$300.00|8.5% undervalued
OS
Community Contributor
Flowers Foods Pays A Fair Price For Health
Fair Value US$16.12|24.6% undervalued
NV
Community Contributor
TMX Group will thrive with 33.3% profit margin and enduring market moat
Fair Value CA$49.90|0.1% undervalued
LI
Community Contributor