Stock Analysis
- United States
- /
- Logistics
- /
- NasdaqGS:HUBG
Are Hub Group, Inc.'s (NASDAQ:HUBG) Fundamentals Good Enough to Warrant Buying Given The Stock's Recent Weakness?


Hub Group (NASDAQ:HUBG) has had a rough week with its share price down 2.9%. But if you pay close attention, you might find that its key financial indicators look quite decent, which could mean that the stock could potentially rise in the long-term given how markets usually reward more resilient long-term fundamentals. In this article, we decided to focus on Hub Group's ROE.
Return on equity or ROE is an important factor to be considered by a shareholder because it tells them how effectively their capital is being reinvested. In short, ROE shows the profit each dollar generates with respect to its shareholder investments.
View our latest analysis for Hub Group
How To Calculate Return On Equity?
ROE can be calculated by using the formula:
Return on Equity = Net Profit (from continuing operations) ÷ Shareholders' Equity
So, based on the above formula, the ROE for Hub Group is:
8.2% = US$133m ÷ US$1.6b (Based on the trailing twelve months to March 2024).
The 'return' is the amount earned after tax over the last twelve months. So, this means that for every $1 of its shareholder's investments, the company generates a profit of $0.08.
What Has ROE Got To Do With Earnings Growth?
We have already established that ROE serves as an efficient profit-generating gauge for a company's future earnings. Based on how much of its profits the company chooses to reinvest or "retain", we are then able to evaluate a company's future ability to generate profits. Assuming all else is equal, companies that have both a higher return on equity and higher profit retention are usually the ones that have a higher growth rate when compared to companies that don't have the same features.
Hub Group's Earnings Growth And 8.2% ROE
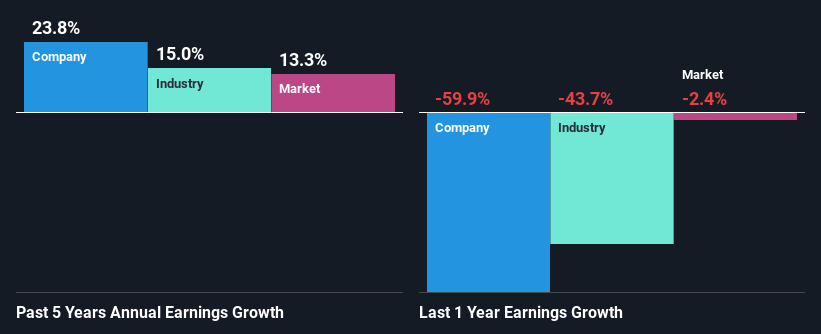
At first glance, Hub Group's ROE doesn't look very promising. We then compared the company's ROE to the broader industry and were disappointed to see that the ROE is lower than the industry average of 12%. However, we we're pleasantly surprised to see that Hub Group grew its net income at a significant rate of 24% in the last five years. We reckon that there could be other factors at play here. For instance, the company has a low payout ratio or is being managed efficiently.
As a next step, we compared Hub Group's net income growth with the industry, and pleasingly, we found that the growth seen by the company is higher than the average industry growth of 15%.
The basis for attaching value to a company is, to a great extent, tied to its earnings growth. The investor should try to establish if the expected growth or decline in earnings, whichever the case may be, is priced in. Doing so will help them establish if the stock's future looks promising or ominous. Has the market priced in the future outlook for HUBG? You can find out in our latest intrinsic value infographic research report.
Is Hub Group Efficiently Re-investing Its Profits?
Hub Group has a really low three-year median payout ratio of 5.9%, meaning that it has the remaining 94% left over to reinvest into its business. So it seems like the management is reinvesting profits heavily to grow its business and this reflects in its earnings growth number.
Upon studying the latest analysts' consensus data, we found that the company's future payout ratio is expected to rise to 9.2% over the next three years. However, Hub Group's future ROE is expected to rise to 11% despite the expected increase in the company's payout ratio. We infer that there could be other factors that could be driving the anticipated growth in the company's ROE.
Conclusion
In total, it does look like Hub Group has some positive aspects to its business. Even in spite of the low rate of return, the company has posted impressive earnings growth as a result of reinvesting heavily into its business. Having said that, the company's earnings growth is expected to slow down, as forecasted in the current analyst estimates. To know more about the latest analysts predictions for the company, check out this visualization of analyst forecasts for the company.
Valuation is complex, but we're helping make it simple.
Find out whether Hub Group is potentially over or undervalued by checking out our comprehensive analysis, which includes fair value estimates, risks and warnings, dividends, insider transactions and financial health.
View the Free AnalysisHave feedback on this article? Concerned about the content? Get in touch with us directly. Alternatively, email editorial-team (at) simplywallst.com.
This article by Simply Wall St is general in nature. We provide commentary based on historical data and analyst forecasts only using an unbiased methodology and our articles are not intended to be financial advice. It does not constitute a recommendation to buy or sell any stock, and does not take account of your objectives, or your financial situation. We aim to bring you long-term focused analysis driven by fundamental data. Note that our analysis may not factor in the latest price-sensitive company announcements or qualitative material. Simply Wall St has no position in any stocks mentioned.
Valuation is complex, but we're helping make it simple.
Find out whether Hub Group is potentially over or undervalued by checking out our comprehensive analysis, which includes fair value estimates, risks and warnings, dividends, insider transactions and financial health.
View the Free AnalysisHave feedback on this article? Concerned about the content? Get in touch with us directly. Alternatively, email editorial-team@simplywallst.com
About NasdaqGS:HUBG
Hub Group
A supply chain solutions provider, offers transportation and logistics management services in North America.
Flawless balance sheet and fair value.
