
Advertisement
- United States
- /
- Transportation
- /
- NasdaqGS:CAR
Avis Budget Group (NASDAQ:CAR) Might Be Having Difficulty Using Its Capital Effectively
If we want to find a potential multi-bagger, often there are underlying trends that can provide clues. In a perfect world, we'd like to see a company investing more capital into its business and ideally the returns earned from that capital are also increasing. Basically this means that a company has profitable initiatives that it can continue to reinvest in, which is a trait of a compounding machine. Having said that, from a first glance at Avis Budget Group (NASDAQ:CAR) we aren't jumping out of our chairs at how returns are trending, but let's have a deeper look.
Understanding Return On Capital Employed (ROCE)
Just to clarify if you're unsure, ROCE is a metric for evaluating how much pre-tax income (in percentage terms) a company earns on the capital invested in its business. To calculate this metric for Avis Budget Group, this is the formula:
Return on Capital Employed = Earnings Before Interest and Tax (EBIT) ÷ (Total Assets - Current Liabilities)
0.03 = US$771m ÷ (US$29b - US$3.4b) (Based on the trailing twelve months to March 2025).
Therefore, Avis Budget Group has an ROCE of 3.0%. Ultimately, that's a low return and it under-performs the Transportation industry average of 9.1%.
See our latest analysis for Avis Budget Group
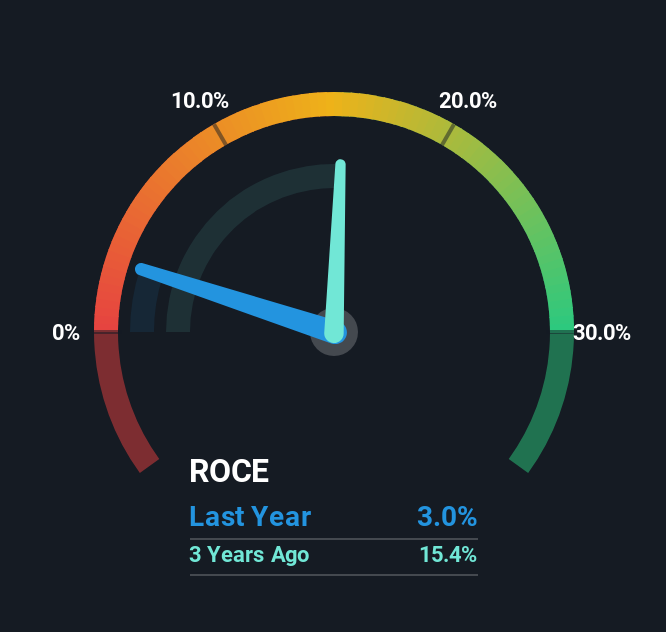
In the above chart we have measured Avis Budget Group's prior ROCE against its prior performance, but the future is arguably more important. If you'd like, you can check out the forecasts from the analysts covering Avis Budget Group for free.
What The Trend Of ROCE Can Tell Us
In terms of Avis Budget Group's historical ROCE movements, the trend isn't fantastic. To be more specific, ROCE has fallen from 3.9% over the last five years. On the other hand, the company has been employing more capital without a corresponding improvement in sales in the last year, which could suggest these investments are longer term plays. It may take some time before the company starts to see any change in earnings from these investments.

The Bottom Line On Avis Budget Group's ROCE
To conclude, we've found that Avis Budget Group is reinvesting in the business, but returns have been falling. Yet to long term shareholders the stock has gifted them an incredible 415% return in the last five years, so the market appears to be rosy about its future. But if the trajectory of these underlying trends continue, we think the likelihood of it being a multi-bagger from here isn't high.
One more thing, we've spotted 1 warning sign facing Avis Budget Group that you might find interesting.
While Avis Budget Group isn't earning the highest return, check out this free list of companies that are earning high returns on equity with solid balance sheets.
New: Manage All Your Stock Portfolios in One Place
We've created the ultimate portfolio companion for stock investors, and it's free.
• Connect an unlimited number of Portfolios and see your total in one currency
• Be alerted to new Warning Signs or Risks via email or mobile
• Track the Fair Value of your stocks
Have feedback on this article? Concerned about the content? Get in touch with us directly. Alternatively, email editorial-team (at) simplywallst.com.
This article by Simply Wall St is general in nature. We provide commentary based on historical data and analyst forecasts only using an unbiased methodology and our articles are not intended to be financial advice. It does not constitute a recommendation to buy or sell any stock, and does not take account of your objectives, or your financial situation. We aim to bring you long-term focused analysis driven by fundamental data. Note that our analysis may not factor in the latest price-sensitive company announcements or qualitative material. Simply Wall St has no position in any stocks mentioned.
M

The Foxhole
A lot of companies don't have a moat, they have customers too busy to switch. AI agents could change that.
149
L
LeverageIsLovely
Meta built an agent that saves you time so you can spend it on Meta.
s
sarah_c5otv
It can only change a little. Adopting AI agents will in itself be a HUGE friction for many.
 Andrew Legget
Market Insights
Are social media stocks the new Big Tobacco?

Greater regulatory scrutiny is catching up with digital platforms, posing a rising risk for social media stocks. But as Big Tobacco discovered, that's not always a bad outcome for shareholders.
14
About NasdaqGS:CAR
Avis Budget Group
Provides car and truck rentals, car sharing, and ancillary products and services to businesses and consumers in the Americas, Europe, the Middle East and Africa, Asia, and Australasia.
Undervalued with moderate growth potential.
Similar Companies
Market Insights


Advertisement
Weekly Picks
CE


Ceazar on Sparc AI ·
When GPS fails: this small cap is fixing a $54B drone problem
Fair Value:CA$5.2537.3% undervalued
198 followersusers have followed this narrative
0 commentsusers have commented on this narrative
30 likesusers have liked this narrative
CO


composite32 on Archrock ·
AI Needs Power. Power Needs Gas. Gas Needs Compression: The Archrock Investment Thesis
Fair Value:US$44.8830.8% undervalued
19 followersusers have followed this narrative
1 commentusers have commented on this narrative
2 likesusers have liked this narrative
JO


John_Eric on Advanced Energy Industries ·
AEIS Is Firing on Every Cylinder. My Problem Is the Safety Factor.
Fair Value:US$567.8655.6% undervalued
12 followersusers have followed this narrative
0 commentsusers have commented on this narrative
7 likesusers have liked this narrative
IS

isidrohg on Lam Research ·
The Memory Shortage Is Lam's Order Book — Whether It Persists Or Resolves
Fair Value:US$423.8536.5% undervalued
14 followersusers have followed this narrative
0 commentsusers have commented on this narrative
6 likesusers have liked this narrative
Recently Updated Narratives
LU


LunaRodas on Aeluma ·
ALMU | Aeluma, Inc.: What They Said vs. What They Did
Fair Value:US$7.6475.8% overvalued
1 followerusers have followed this narrative
0 commentsusers have commented on this narrative
0 likesusers have liked this narrative
RE


RedCandleRx on AppLovin ·
Why the Market Still Misprices AppLovin as Just a Gaming Network
Fair Value:US$50735.6% undervalued
1 followerusers have followed this narrative
0 commentsusers have commented on this narrative
0 likesusers have liked this narrative
BR


Brunhilde_Wagner on Copart ·
Compounder to Cash Generator in Real Time
Fair Value:US$2523.2% overvalued
2 followersusers have followed this narrative
0 commentsusers have commented on this narrative
0 likesusers have liked this narrative
Popular Narratives
AN


AnalystConsensusTarget on NVIDIA ·
NVDA: Expanding AI Demand Will Drive Major Data Center Investments Through 2026
Fair Value:US$302.8329.4% undervalued
1458 followersusers have followed this narrative
8 commentsusers have commented on this narrative
35 likesusers have liked this narrative
AN

AnalystConsensusTarget on Alphabet ·
GOOGL: AI Platform Expansion And Cloud Demand Will Support Durable Performance Amid Competitive Pressures
Fair Value:US$427.8919.9% undervalued
1634 followersusers have followed this narrative
0 commentsusers have commented on this narrative
19 likesusers have liked this narrative
AN

AnalystConsensusTarget on Amazon.com ·
AMZN: Acceleration In Cloud And AI Will Drive Margin Expansion Ahead
Fair Value:US$32724.8% undervalued
1646 followersusers have followed this narrative
1 commentusers have commented on this narrative
16 likesusers have liked this narrative
Trending Discussion
AN

anthony_x0j2w on Platform Group SE KGaA ·
Hello,(I am a shareholder).I spent the summer investigating in whatever I was able to find in the press, the trustee, or legal, and comparing it to FS Benner's declaration/transcripts:press: MM has a tendancy to use facts, modify them and turn them the way they want: 100% of their claims against TPG0 is traçable factually, 80% is flawed and interpreted. Example are numerous: 11M loans banks to be paid seems right, but it has not been an issue at all, it has been paid in full. (and it happens all the time in every business...); the previous HR becoming a financial director in the article herself being attacked by TPG on the legal side; the wrong address of curator (if truly announced by TPG).Trustee: according to my research (which can be incomplete) no communication to the Nordic trustee (hereby, bond holders) has been done on a, indebtedness (late payment) > 1M€, which is their obligation by contract (clause 14.d - https://corporate.the-platform-group.com/bond/) => this is a sign of a huge lie and fraud, or the sign that there is no indebtedness > 1M€ over the whole TPG group.Legal: still awaiting for an answer, probable that I won't get it.VALUATIONYou can spent hours working the fundamentals, if they're flawed...the thesis falls.Anyway, I always substracts the badwill (that I consider non-current - you have it in the CFS) & non-controlling interests from my valuation:Earnings ~22MFCF ~40M€The financial statements are not the issue here, we are more on an cheap option on the sincerity of the accounts that a real valuation. Unfortunately, these are unverifiable elements, hence the low price./!\ Careful:the accounts are consolidated and skip the subsidiaries issues...Careful with the business model: TPG0 is a financial holding that acquire subsidiaries, hold the debt, and has no operations. 100% of the Cash Flow comes from subs' dividends => it is a risk here, more a plumber risk than an operational one, but nevertheless...The auditor is too small, and managed by the same firm than before, with 140K€/year commission => it's too low, nobody external really reviewed what Benner and his team are doing internallycapital increase do not go through the CFS, but through change in equity AND equity in the BSIf the equity stays low too long, the WACC increase will be unbearable (I have a 30% global, with a 118% on equity): diluting is expensive => TPG machine can stay broken for a while.Most of the people I talk with never saw this, while this is ESSENTIAL to Benner's business model.SEVERAL EVENTS THAT COULD CHANGE:AEP is being audited by KPMG: if Benner plays the "we will propose KPMG to our shareholders BEOY", this can increase the trust in him significantly/KPMG (or other) to validate the 2026 IFRS accounts & having a word on HGB's: though still consolidated, at least we'll know...AEP being eventually acquired: while it carries a high integration risk due to its size, they talked about it so many times, that trust goes with it.Without this combination of event, the equity is doomed to stay at this level, IMO.Do not forget to also follow the bond: with TPG's announced safe harbor plan for buyback (25% of daily exchange), it is also interesting to check this illiquid and retail market: https://live.deutsche-boerse.com/bond/no0013256834-the-platform-group-ag-8-875-24-28?mic=XFRA
1
|0
CO

Constantin_Mar on Platform Group SE KGaA ·
Quite a lot of speculation presented as if it were evidence.You are combining alleged payment disputes, alleged bank actions, legal disputes with journalists and other unverified claims to imply that TPG’s financial reporting is somehow unreliable or that the company is approaching insolvency. That’s a very serious conclusion, but the evidence you’ve presented doesn’t establish it.TPG’s financial statements, share count, debt, cash flow and acquisitions can all be checked against official filings and corporate documents. That’s called due diligence. Repeating allegations and then pointing to a low P/E doesn’t prove anything.In fact, the P/E below 1 is precisely the reason the underlying numbers need to be investigated rather than dismissed. If you have documentary evidence that TPG’s reported figures are false, that banks actually cancelled the alleged facilities, or that the company is insolvent, publish the documents and numbers.Otherwise, this reads less like analysis and more like an attempt to create fear and selling pressure around a micro-cap stock.Claims require evidence. Allegations are not evidence.
1
|1
