Advertisement
- United States
- /
- Wireless Telecom
- /
- NasdaqGS:TMUS
Is T-Mobile’s Recent 8.7% Price Drop an Opportunity for Investors in 2025?

Simply Wall St
Reviewed by Bailey Pemberton
Are you sizing up your next move with T-Mobile US stock? You are not alone. Over the past month, T-Mobile's share price has been on a bit of a rollercoaster, dipping by 8.7% in the last 30 days and 5.0% over the past week. Its performance over the longer term tells a different story. In the last three years, investors have seen an impressive 48.5% gain, and if you zoom out to five years, the stock has more than doubled, up 104.7%. That kind of growth is hard to ignore, even if the past twelve months have been less inspiring, with a modest 2.4% slide.
Behind these moves, investors are weighing the impact of T-Mobile's recent innovations and aggressive 5G expansion initiatives, as well as its ongoing investments in rural coverage. While these headlines have not dramatically swung the stock, they have certainly kept T-Mobile in the national conversation, especially as competitors jockey for position in the ever-evolving wireless market. These shifts may not always spark instant share price rallies, but they change the narrative around the company's long-term value and risk profile.
If you are keen on numbers, here is something to consider: T-Mobile currently stands with a value score of 3 out of 6, meaning it is judged to be undervalued on half of the most widely used valuation checks. That is neither a screaming bargain nor a stock to ignore. That is exactly why it is worth digging deeper. Next, we will break down how T-Mobile's valuation stacks up according to different investment approaches, and later on, we will explore an even smarter way to think about what "undervalued" really means for you as an investor.
Why T-Mobile US is lagging behind its peers
Approach 1: T-Mobile US Discounted Cash Flow (DCF) Analysis
The Discounted Cash Flow (DCF) model estimates a company's current value by projecting its future cash flows and then discounting those expected amounts back to today's dollars. This approach focuses on T-Mobile US's ability to generate free cash flow over time, helping investors gauge the business's true worth beyond just near-term market sentiment.
Right now, T-Mobile is generating Free Cash Flow of $14.0 Billion. Looking ahead, analysts forecast ongoing growth, expecting Free Cash Flow to climb to about $24.1 Billion by the end of 2029. The first five years of these projections come from direct analyst estimates, while further-out numbers are extrapolated for context to reflect a realistic trend in the company's ability to generate cash.
Applying this cash flow growth to the DCF model results in an estimated intrinsic value of $533.48 per share. This is a substantial 59.2% discount compared to the current share price, which suggests that T-Mobile stock is trading well below what this projection estimates it is worth.
In summary, the DCF model indicates that T-Mobile US may be significantly undervalued at the moment when considering its long-term cash-generating power.
Result: UNDERVALUED
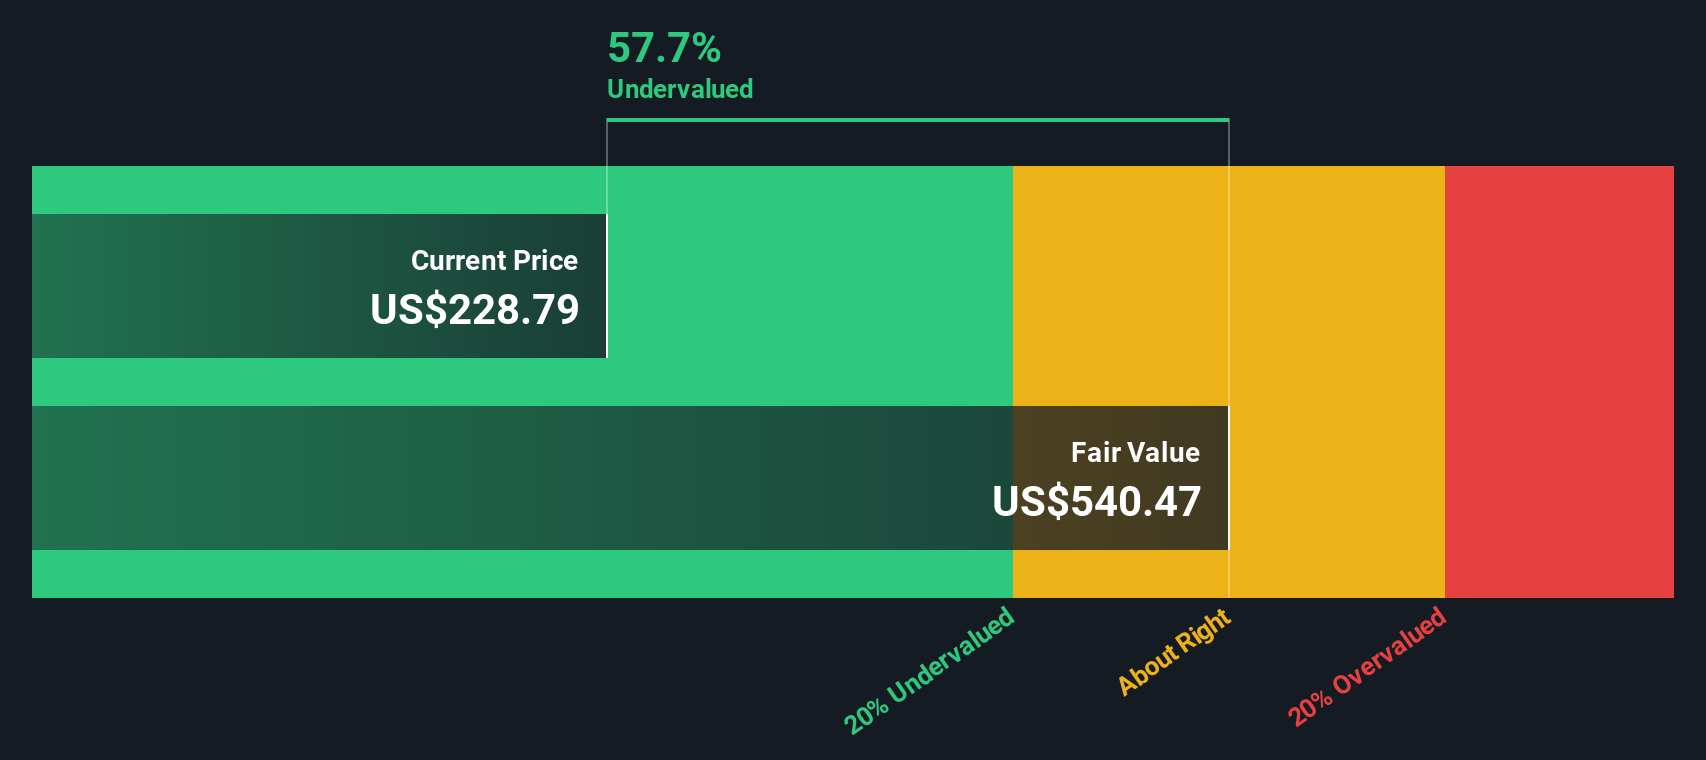
Our Discounted Cash Flow (DCF) analysis suggests T-Mobile US is undervalued by 59.2%. Track this in your watchlist or portfolio, or discover more undervalued stocks.
Approach 2: T-Mobile US Price vs Earnings
The Price-to-Earnings (PE) ratio is a popular metric for valuing profitable companies like T-Mobile US because it directly connects a company’s market value to its bottom-line profitability. This makes it especially relevant for businesses with stable earnings. It provides investors with a quick way to judge how much they are willing to pay for each dollar of current earnings, taking into account future growth prospects and perceived risks.
A "normal" or "fair" PE ratio for a stock depends on more than just its current profits. Expectations for future earnings growth, the company’s risk profile, and the broader industry environment all play crucial roles. Higher growth or lower risk generally justifies a higher PE, while riskier or slow-growth companies tend to trade at lower PE multiples.
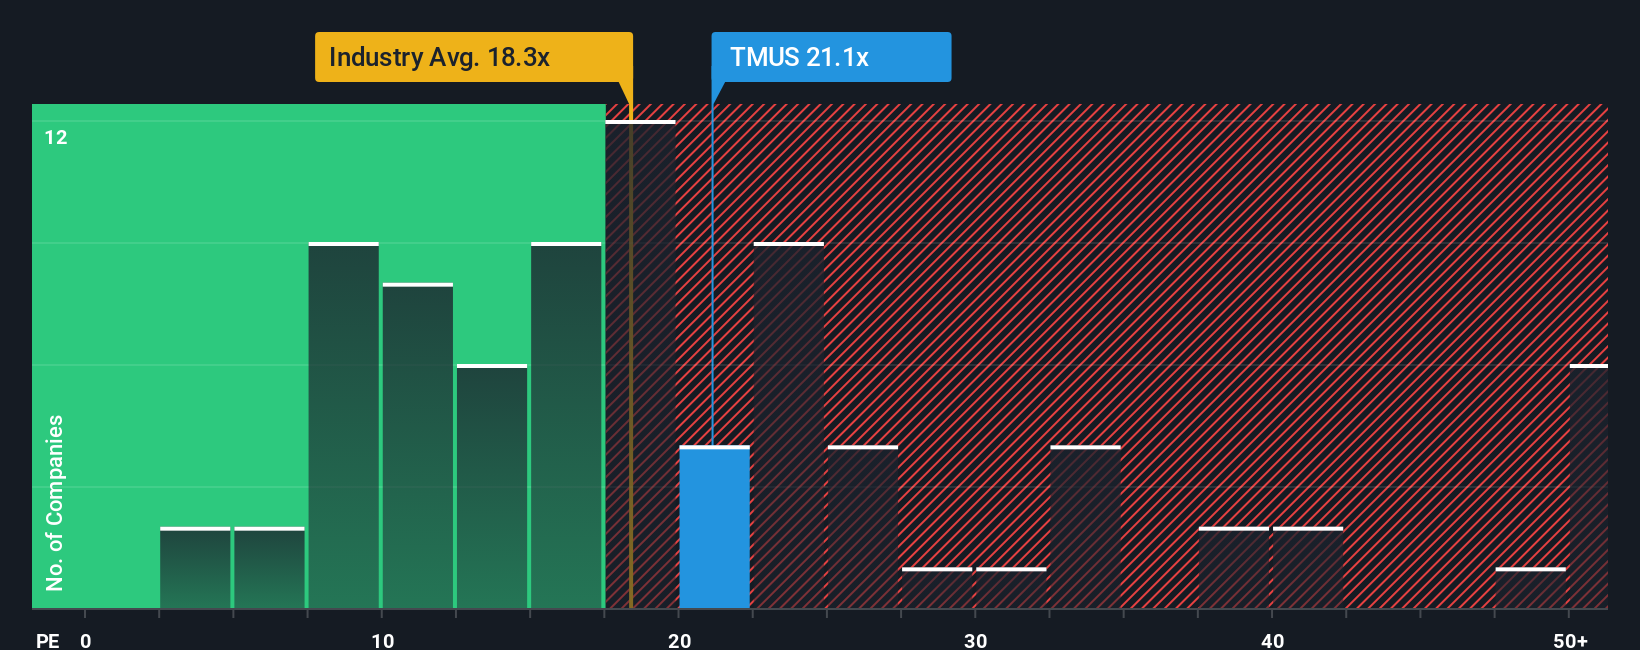
T-Mobile US currently trades at a PE ratio of 20.52x. For comparison, the industry average is 18.39x, and its peers, on average, trade at 7.50x. These comparisons suggest T-Mobile’s shares are priced higher than most competitors in its space, reflecting the company’s scale and consistent performance. However, relying solely on these benchmarks can be misleading, as they do not account for company-specific growth rates, profit margins, risks, or market capitalization.
This is where the Simply Wall St "Fair Ratio" comes in. The Fair Ratio is a proprietary calculation that incorporates T-Mobile’s specific earnings growth potential, its profit margins, sector dynamics, and scale. It provides a holistic and tailored benchmark for valuation rather than a simple industry or peer comparison. For T-Mobile US, the Fair Ratio is 17.43x.
When comparing T-Mobile’s actual PE of 20.52x to the Fair Ratio of 17.43x, the difference is more than marginal. This suggests the stock is trading at a premium versus what would be considered fair value given its fundamentals.
Result: OVERVALUED
PE ratios tell one story, but what if the real opportunity lies elsewhere? Discover companies where insiders are betting big on explosive growth.
Upgrade Your Decision Making: Choose your T-Mobile US Narrative
Earlier we mentioned that there is an even better way to understand valuation. Let us introduce you to Narratives. Simply put, a Narrative is your story about a company. It weaves together your assumptions about future revenue, earnings, and margins, connects them to financial forecasts, and calculates a fair value based on what you believe is likely.
Narratives make investing more accessible by linking these real-world perspectives and forecasts to actionable decisions. On Simply Wall St’s Community page, you can create or explore Narratives for T-Mobile US, quickly see how your outlook compares to millions of other investors, and update your view as new information becomes available, such as news or earnings releases.
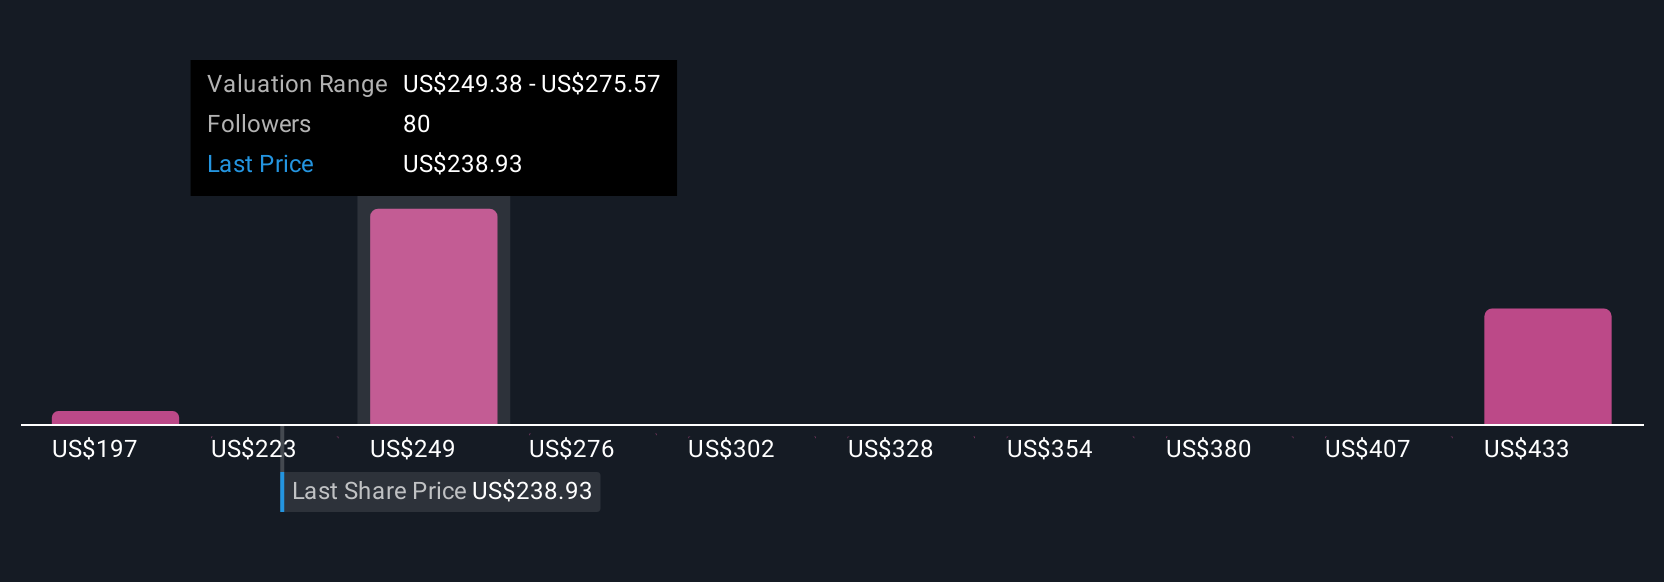
By comparing each Narrative’s Fair Value to the current Price, you gain clarity on when to buy or sell. For example, some T-Mobile US Narratives are bullish, projecting a Fair Value as high as $309.0, based on upbeat earnings forecasts and margin expansion. Others are more cautious, with Fair Values as low as $200.0, reflecting concerns over competitive pressures or profit risks. Narratives evolve as facts change, putting your perspective, not just the numbers, at the center of your investment strategy.
Do you think there's more to the story for T-Mobile US? Create your own Narrative to let the Community know!
This article by Simply Wall St is general in nature. We provide commentary based on historical data and analyst forecasts only using an unbiased methodology and our articles are not intended to be financial advice. It does not constitute a recommendation to buy or sell any stock, and does not take account of your objectives, or your financial situation. We aim to bring you long-term focused analysis driven by fundamental data. Note that our analysis may not factor in the latest price-sensitive company announcements or qualitative material. Simply Wall St has no position in any stocks mentioned.
Valuation is complex, but we're here to simplify it.
Discover if T-Mobile US might be undervalued or overvalued with our detailed analysis, featuring fair value estimates, potential risks, dividends, insider trades, and its financial condition.
Access Free AnalysisHave feedback on this article? Concerned about the content? Get in touch with us directly. Alternatively, email editorial-team@simplywallst.com
About NasdaqGS:TMUS
T-Mobile US
Provides wireless communications services in the United States, Puerto Rico, and the United States Virgin Islands.
Proven track record and fair value.
Similar Companies
Market Insights

Advertisement
Community Narratives
Finding The True Value Of A Logistics Powerhouse
Fair Value US$95.21|8.4% undervalued
NV
Community Contributor
Paradigm Biopharmaceuticals Will Lead Osteoarthritis Treatment with Zilosul's FDA Success
Fair Value AU$5.50|92.1% undervalued
AM
Community Contributor
Barrick Mining (ABX:CA): A Gold Hedge against a U.S. Shutdown
Fair Value CA$60.00|24.2% undervalued
GM
Community Contributor