- United States
- /
- Wireless Telecom
- /
- NasdaqGS:TIGO
Reflecting on Millicom International Cellular's (NASDAQ:TIGO) Share Price Returns Over The Last Three Years


While not a mind-blowing move, it is good to see that the Millicom International Cellular S.A. (NASDAQ:TIGO) share price has gained 26% in the last three months. But that doesn't help the fact that the three year return is less impressive. After all, the share price is down 45% in the last three years, significantly under-performing the market.
View our latest analysis for Millicom International Cellular
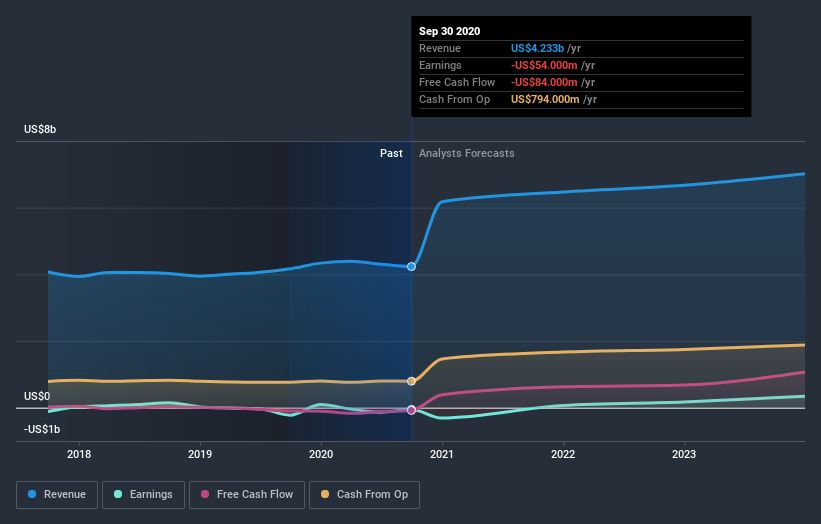
Millicom International Cellular isn't currently profitable, so most analysts would look to revenue growth to get an idea of how fast the underlying business is growing. When a company doesn't make profits, we'd generally expect to see good revenue growth. As you can imagine, fast revenue growth, when maintained, often leads to fast profit growth.
Over three years, Millicom International Cellular grew revenue at 2.9% per year. Given it's losing money in pursuit of growth, we are not really impressed with that. The stock dropped 13% during that time. If revenue growth accelerates, we might see the share price bounce. But the real upside for shareholders will be if the company can start generating profits.
The graphic below depicts how earnings and revenue have changed over time (unveil the exact values by clicking on the image).
We consider it positive that insiders have made significant purchases in the last year. Even so, future earnings will be far more important to whether current shareholders make money. So it makes a lot of sense to check out what analysts think Millicom International Cellular will earn in the future (free profit forecasts).
What About Dividends?
When looking at investment returns, it is important to consider the difference between total shareholder return (TSR) and share price return. Whereas the share price return only reflects the change in the share price, the TSR includes the value of dividends (assuming they were reinvested) and the benefit of any discounted capital raising or spin-off. Arguably, the TSR gives a more comprehensive picture of the return generated by a stock. We note that for Millicom International Cellular the TSR over the last 3 years was -40%, which is better than the share price return mentioned above. This is largely a result of its dividend payments!
A Different Perspective
Investors in Millicom International Cellular had a tough year, with a total loss of 20% (including dividends), against a market gain of about 26%. However, keep in mind that even the best stocks will sometimes underperform the market over a twelve month period. Longer term investors wouldn't be so upset, since they would have made 1.2%, each year, over five years. It could be that the recent sell-off is an opportunity, so it may be worth checking the fundamental data for signs of a long term growth trend. While it is well worth considering the different impacts that market conditions can have on the share price, there are other factors that are even more important. For instance, we've identified 2 warning signs for Millicom International Cellular (1 is potentially serious) that you should be aware of.
Millicom International Cellular is not the only stock insiders are buying. So take a peek at this free list of growing companies with insider buying.
Please note, the market returns quoted in this article reflect the market weighted average returns of stocks that currently trade on US exchanges.
When trading Millicom International Cellular or any other investment, use the platform considered by many to be the Professional's Gateway to the Worlds Market, Interactive Brokers. You get the lowest-cost* trading on stocks, options, futures, forex, bonds and funds worldwide from a single integrated account. Promoted
New: Manage All Your Stock Portfolios in One Place
We've created the ultimate portfolio companion for stock investors, and it's free.
• Connect an unlimited number of Portfolios and see your total in one currency
• Be alerted to new Warning Signs or Risks via email or mobile
• Track the Fair Value of your stocks
This article by Simply Wall St is general in nature. It does not constitute a recommendation to buy or sell any stock, and does not take account of your objectives, or your financial situation. We aim to bring you long-term focused analysis driven by fundamental data. Note that our analysis may not factor in the latest price-sensitive company announcements or qualitative material. Simply Wall St has no position in any stocks mentioned.
*Interactive Brokers Rated Lowest Cost Broker by StockBrokers.com Annual Online Review 2020
Have feedback on this article? Concerned about the content? Get in touch with us directly. Alternatively, email editorial-team (at) simplywallst.com.
About NasdaqGS:TIGO
Millicom International Cellular
Provides cable and mobile services in Latin America.
Average dividend payer and fair value.
Similar Companies
Market Insights

Community Narratives

