
Advertisement
- United States
- /
- Wireless Telecom
- /
- NasdaqGS:TIGO
Our Take On The Returns On Capital At Millicom International Cellular (NASDAQ:TIGO)

What trends should we look for it we want to identify stocks that can multiply in value over the long term? Firstly, we'll want to see a proven return on capital employed (ROCE) that is increasing, and secondly, an expanding base of capital employed. Ultimately, this demonstrates that it's a business that is reinvesting profits at increasing rates of return. However, after investigating Millicom International Cellular (NASDAQ:TIGO), we don't think it's current trends fit the mold of a multi-bagger.
Understanding Return On Capital Employed (ROCE)
If you haven't worked with ROCE before, it measures the 'return' (pre-tax profit) a company generates from capital employed in its business. Analysts use this formula to calculate it for Millicom International Cellular:
Return on Capital Employed = Earnings Before Interest and Tax (EBIT) ÷ (Total Assets - Current Liabilities)
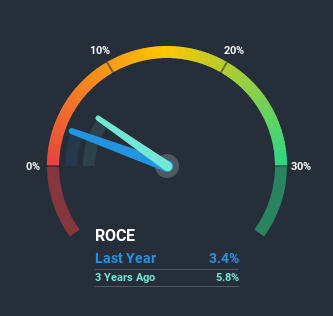
0.034 = US$340m ÷ (US$12b - US$2.2b) (Based on the trailing twelve months to September 2020).
Thus, Millicom International Cellular has an ROCE of 3.4%. On its own that's a low return on capital but it's in line with the industry's average returns of 2.8%.
See our latest analysis for Millicom International Cellular
Above you can see how the current ROCE for Millicom International Cellular compares to its prior returns on capital, but there's only so much you can tell from the past. If you'd like to see what analysts are forecasting going forward, you should check out our free report for Millicom International Cellular.
How Are Returns Trending?
On the surface, the trend of ROCE at Millicom International Cellular doesn't inspire confidence. Around five years ago the returns on capital were 12%, but since then they've fallen to 3.4%. On the other hand, the company has been employing more capital without a corresponding improvement in sales in the last year, which could suggest these investments are longer term plays. It may take some time before the company starts to see any change in earnings from these investments.
On a related note, Millicom International Cellular has decreased its current liabilities to 18% of total assets. So we could link some of this to the decrease in ROCE. What's more, this can reduce some aspects of risk to the business because now the company's suppliers or short-term creditors are funding less of its operations. Some would claim this reduces the business' efficiency at generating ROCE since it is now funding more of the operations with its own money.What We Can Learn From Millicom International Cellular's ROCE
In summary, Millicom International Cellular is reinvesting funds back into the business for growth but unfortunately it looks like sales haven't increased much just yet. And with the stock having returned a mere 5.6% in the last five years to shareholders, you could argue that they're aware of these lackluster trends. As a result, if you're hunting for a multi-bagger, we think you'd have more luck elsewhere.
Millicom International Cellular does have some risks, we noticed 3 warning signs (and 1 which is concerning) we think you should know about.
For those who like to invest in solid companies, check out this free list of companies with solid balance sheets and high returns on equity.
When trading Millicom International Cellular or any other investment, use the platform considered by many to be the Professional's Gateway to the Worlds Market, Interactive Brokers. You get the lowest-cost* trading on stocks, options, futures, forex, bonds and funds worldwide from a single integrated account. Promoted
New: Manage All Your Stock Portfolios in One Place
We've created the ultimate portfolio companion for stock investors, and it's free.
• Connect an unlimited number of Portfolios and see your total in one currency
• Be alerted to new Warning Signs or Risks via email or mobile
• Track the Fair Value of your stocks
This article by Simply Wall St is general in nature. It does not constitute a recommendation to buy or sell any stock, and does not take account of your objectives, or your financial situation. We aim to bring you long-term focused analysis driven by fundamental data. Note that our analysis may not factor in the latest price-sensitive company announcements or qualitative material. Simply Wall St has no position in any stocks mentioned.
*Interactive Brokers Rated Lowest Cost Broker by StockBrokers.com Annual Online Review 2020
Have feedback on this article? Concerned about the content? Get in touch with us directly. Alternatively, email editorial-team (at) simplywallst.com.
About NasdaqGS:TIGO
Millicom International Cellular
Provides cable and mobile services in Latin America.
Average dividend payer and fair value.
Similar Companies
Market Insights

Advertisement
Community Narratives
Groundbreaking therapies that could change the treatment landscape for PTSD, fibromyalgia, MS & Alzheimer’s
Fair Value US$6.20|86.9% undervalued
CM
Community Contributor
DigitalOcean Will Grow 14% by Embracing AI with Paperspace Acquisition
Fair Value US$50.00|41.7% undervalued
NE
Community Contributor
Viant Technology: A Rising AdTech Challenger in the AI-Powered CTV Market
Fair Value US$38.61|63.2% undervalued
BL
Community Contributor
Volvo will Accelerate Forward into Electric and Autonomous Leadership in Five Years
Fair Value SEK 438.80|39.7% undervalued
UN
Community Contributor