- United States
- /
- Wireless Telecom
- /
- NasdaqCM:FNGR
Why Investors Shouldn't Be Surprised By FingerMotion, Inc.'s (NASDAQ:FNGR) 42% Share Price Surge
Those holding FingerMotion, Inc. (NASDAQ:FNGR) shares would be relieved that the share price has rebounded 42% in the last thirty days, but it needs to keep going to repair the recent damage it has caused to investor portfolios. Not all shareholders will be feeling jubilant, since the share price is still down a very disappointing 20% in the last twelve months.
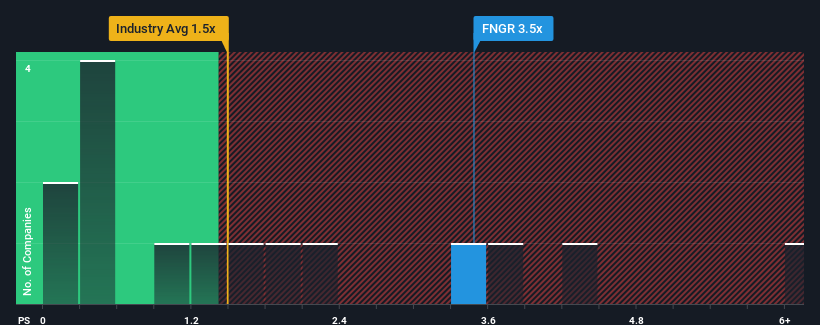
Following the firm bounce in price, given around half the companies in the United States' Wireless Telecom industry have price-to-sales ratios (or "P/S") below 1.2x, you may consider FingerMotion as a stock to avoid entirely with its 3.5x P/S ratio. However, the P/S might be quite high for a reason and it requires further investigation to determine if it's justified.
View our latest analysis for FingerMotion

What Does FingerMotion's P/S Mean For Shareholders?
Revenue has risen firmly for FingerMotion recently, which is pleasing to see. It might be that many expect the respectable revenue performance to beat most other companies over the coming period, which has increased investors’ willingness to pay up for the stock. However, if this isn't the case, investors might get caught out paying to much for the stock.
Want the full picture on earnings, revenue and cash flow for the company? Then our free report on FingerMotion will help you shine a light on its historical performance.What Are Revenue Growth Metrics Telling Us About The High P/S?
There's an inherent assumption that a company should far outperform the industry for P/S ratios like FingerMotion's to be considered reasonable.
If we review the last year of revenue growth, the company posted a terrific increase of 18%. This great performance means it was also able to deliver immense revenue growth over the last three years. So we can start by confirming that the company has done a tremendous job of growing revenue over that time.
This is in contrast to the rest of the industry, which is expected to grow by 1.2% over the next year, materially lower than the company's recent medium-term annualised growth rates.
With this in consideration, it's not hard to understand why FingerMotion's P/S is high relative to its industry peers. Presumably shareholders aren't keen to offload something they believe will continue to outmanoeuvre the wider industry.
The Final Word
FingerMotion's P/S has grown nicely over the last month thanks to a handy boost in the share price. Generally, our preference is to limit the use of the price-to-sales ratio to establishing what the market thinks about the overall health of a company.
It's no surprise that FingerMotion can support its high P/S given the strong revenue growth its experienced over the last three-year is superior to the current industry outlook. At this stage investors feel the potential continued revenue growth in the future is great enough to warrant an inflated P/S. Barring any significant changes to the company's ability to make money, the share price should continue to be propped up.
You need to take note of risks, for example - FingerMotion has 4 warning signs (and 2 which are potentially serious) we think you should know about.
If companies with solid past earnings growth is up your alley, you may wish to see this free collection of other companies with strong earnings growth and low P/E ratios.
New: AI Stock Screener & Alerts
Our new AI Stock Screener scans the market every day to uncover opportunities.
• Dividend Powerhouses (3%+ Yield)
• Undervalued Small Caps with Insider Buying
• High growth Tech and AI Companies
Or build your own from over 50 metrics.
Have feedback on this article? Concerned about the content? Get in touch with us directly. Alternatively, email editorial-team (at) simplywallst.com.
This article by Simply Wall St is general in nature. We provide commentary based on historical data and analyst forecasts only using an unbiased methodology and our articles are not intended to be financial advice. It does not constitute a recommendation to buy or sell any stock, and does not take account of your objectives, or your financial situation. We aim to bring you long-term focused analysis driven by fundamental data. Note that our analysis may not factor in the latest price-sensitive company announcements or qualitative material. Simply Wall St has no position in any stocks mentioned.
About NasdaqCM:FNGR
FingerMotion
A mobile data specialist company, provides mobile payment and recharge platform system in China.
Flawless balance sheet with low risk.
Market Insights
Community Narratives


