Advertisement
- United States
- /
- Telecom Services and Carriers
- /
- NasdaqGS:CMCSA
Is Comcast (CMCSA) Pricing Reflect Its Recent Share Slide And Valuation Signals?

Simply Wall St
Reviewed by Bailey Pemberton
- If you have been wondering whether Comcast's current share price reflects its underlying value, you are not alone. This article is designed to help you unpack that question step by step.
- Comcast shares last closed at US$29.43, with recent returns of 5.8% over 7 days, a 0.8% decline over 30 days, a 0.4% decline year to date, a 14.4% decline over 1 year, an 11.6% decline over 3 years, and a 27.5% decline over 5 years.
- Recent news coverage around Comcast has focused on its position in US telecommunications and media, with investors paying attention to how its broadband, media, and theme park operations are being discussed in the context of the wider sector. These developments help frame how the market is currently thinking about Comcast's risks and potential, which in turn shapes how its valuation is viewed.
- Comcast currently scores a 5 out of 6 valuation score based on a set of pricing checks that assess whether the stock appears undervalued. In the next sections we will walk through what those methods indicate, then finish with a different way of looking at valuation that many investors find more useful.
Find out why Comcast's -14.4% return over the last year is lagging behind its peers.
Approach 1: Comcast Discounted Cash Flow (DCF) Analysis
A Discounted Cash Flow, or DCF, model estimates what a business could be worth today by projecting its future cash flows and then discounting those back into present dollars.
For Comcast, the model uses its last twelve months Free Cash Flow of about US$17.6b as a starting point, then applies a 2 Stage Free Cash Flow to Equity approach. Analysts provide specific Free Cash Flow estimates out to 2028, with US$18.3b projected for 2028, and further annual figures out to 2035 are extrapolated rather than based on direct analyst forecasts.
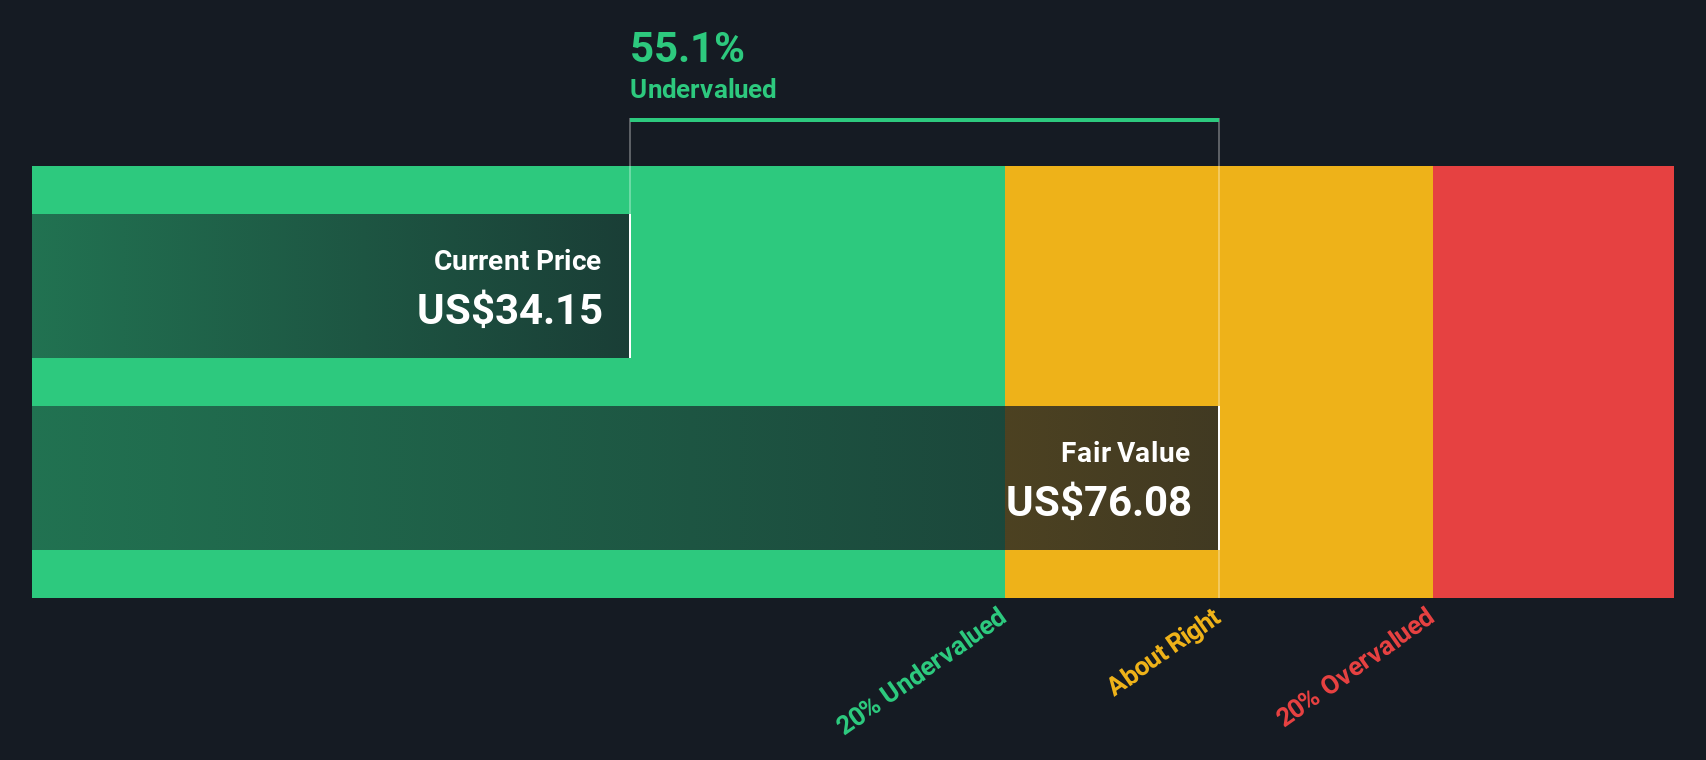
When all those projected cash flows are discounted back using this method, the model arrives at an estimated intrinsic value of US$104.33 per share. Against the recent share price of US$29.43, this implies the stock is trading at a 71.8% discount to the DCF estimate, which suggests the shares screen as significantly undervalued on this framework.
Result: UNDERVALUED
Our Discounted Cash Flow (DCF) analysis suggests Comcast is undervalued by 71.8%. Track this in your watchlist or portfolio, or discover 888 more undervalued stocks based on cash flows.
Approach 2: Comcast Price vs Earnings
For a profitable business like Comcast, the P/E ratio is a useful way to think about value because it links what you pay per share to the earnings that each share generates.
What counts as a normal or fair P/E partly comes down to how the market views a company’s growth potential and risk profile, with higher expected growth or lower perceived risk often lining up with a higher P/E, and the reverse also being true.
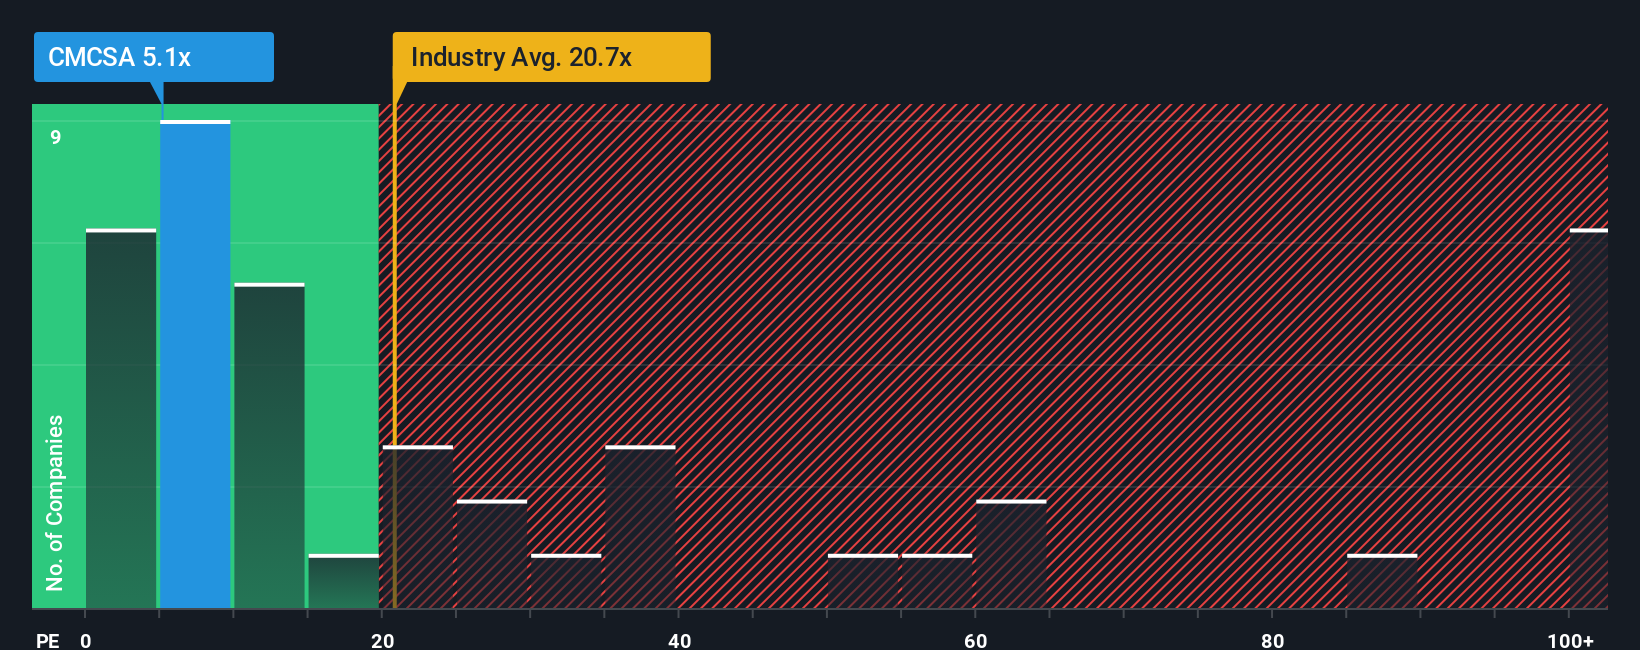
Comcast currently trades on a P/E of 4.74x. That sits below the Telecom industry average of 16.59x and below the peer average of 5.66x that Simply Wall St uses for comparison.
Simply Wall St also calculates a Fair Ratio of 8.13x for Comcast, which is the P/E level that their model suggests could make sense given factors such as the company’s earnings growth, profit margins, industry, market cap and risk profile.
This Fair Ratio can be more informative than a straight comparison with peers or the industry, because it adjusts for company specific features rather than assuming all Telecom stocks deserve similar P/E levels.
With Comcast trading on 4.74x compared with a Fair Ratio of 8.13x, the shares appear inexpensive on this framework.
Result: UNDERVALUED
P/E ratios tell one story, but what if the real opportunity lies elsewhere? Discover 1425 companies where insiders are betting big on explosive growth.
Upgrade Your Decision Making: Choose your Comcast Narrative
Earlier we mentioned that there is an even better way to understand valuation, so let us introduce you to Narratives.
A Narrative is simply your story about Comcast, written in numbers, where you link your view on its broadband, media and theme park future to specific assumptions for revenue, earnings and profit margins. These then flow through to a fair value per share.
On Simply Wall St, Narratives live in the Community page and are designed to be easy to use. You can connect a clear written thesis to a forecast model and instantly see how your fair value compares with the current market price to help you decide whether Comcast looks expensive or inexpensive to you.
Because Narratives on the platform update when new information comes in, such as fresh earnings or major news, your view on Comcast can stay aligned with the latest data. You might even see one investor with a very optimistic Comcast Narrative sitting alongside another that is far more conservative, each with a different fair value based on their own assumptions.
Do you think there's more to the story for Comcast? Head over to our Community to see what others are saying!

This article by Simply Wall St is general in nature. We provide commentary based on historical data and analyst forecasts only using an unbiased methodology and our articles are not intended to be financial advice. It does not constitute a recommendation to buy or sell any stock, and does not take account of your objectives, or your financial situation. We aim to bring you long-term focused analysis driven by fundamental data. Note that our analysis may not factor in the latest price-sensitive company announcements or qualitative material. Simply Wall St has no position in any stocks mentioned.
New: AI Stock Screener & Alerts
Our new AI Stock Screener scans the market every day to uncover opportunities.
• Dividend Powerhouses (3%+ Yield)
• Undervalued Small Caps with Insider Buying
• High growth Tech and AI Companies
Or build your own from over 50 metrics.
Have feedback on this article? Concerned about the content? Get in touch with us directly. Alternatively, email editorial-team@simplywallst.com
About NasdaqGS:CMCSA
Comcast
Operates as a media and technology company worldwide.
6 star dividend payer and undervalued.
Similar Companies
Market Insights


Advertisement
Weekly Picks
ST


stuart_roberts on Unicycive Therapeutics ·
Looking to be second time lucky with a game-changing new product
Fair Value:US$21.5371.1% undervalued
29 followersusers have followed this narrative
0 commentsusers have commented on this narrative
5 likesusers have liked this narrative
HE

HegelBayeBagel on PlaySide Studios ·
PlaySide Studios: Market Is Sleeping on a Potential 10M+ Unit Breakout Year, FY26 Could Be the Rerate of the Decade
Fair Value:AU$0.8465.5% undervalued
6 followersusers have followed this narrative
1 commentusers have commented on this narrative
3 likesusers have liked this narrative
AN


AnimalDoctorKwon on Inotiv ·
Inotiv NAMs Test Center
Fair Value:US$1.275.7% undervalued
5 followersusers have followed this narrative
0 commentsusers have commented on this narrative
3 likesusers have liked this narrative
TH

TheValueDetector on Cognyte Software ·
This isn’t speculation — this is confirmation.A Schedule 13G was filed, not a 13D, meaning this is passive institutional capital, not acti
Fair Value:US$95.6792.6% undervalued
3 followersusers have followed this narrative
0 commentsusers have commented on this narrative
0 likesusers have liked this narrative
Recently Updated Narratives
CO


composite32 on Freehold Royalties ·
Freehold: Offers a fantastic growth-income intersection up to $50 WTI. Below $50 WTI, it may offer historic opportunities in terms of ROI.
Fair Value:CA$19.3811.9% undervalued
4 followersusers have followed this narrative
0 commentsusers have commented on this narrative
0 likesusers have liked this narrative
UN

unknown on Gold Fields ·
Beyond the "Value Trap"—Defending the $50 Intrinsic Floor
Fair Value:US$64.219.8% undervalued
1 followerusers have followed this narrative
0 commentsusers have commented on this narrative
0 likesusers have liked this narrative
UN

unknown on State Street SPDR S&P 500 ETF Trust ·
The Concentration Trap: Why the S&P 500 Is No Longer a 'Safe' Diversifier
Fair Value:US$58915.9% overvalued
2 followersusers have followed this narrative
0 commentsusers have commented on this narrative
0 likesusers have liked this narrative
Popular Narratives
DA


davidlsander on Ubisoft Entertainment ·
Is Ubisoft the Market’s Biggest Pricing Error? Why Forensic Value Points to €33 Per Share
Fair Value:€33.887.4% undervalued
59 followersusers have followed this narrative
5 commentsusers have commented on this narrative
25 likesusers have liked this narrative
TA


Talos on Tesla ·
The "Physical AI" Monopoly – A New Industrial Revolution
Fair Value:US$665.3638.3% undervalued
45 followersusers have followed this narrative
18 commentsusers have commented on this narrative
22 likesusers have liked this narrative
AN


AnalystConsensusTarget on NVIDIA ·
NVDA: Expanding AI Demand Will Drive Major Data Center Investments Through 2026
Fair Value:US$253.0226.9% undervalued
1074 followersusers have followed this narrative
6 commentsusers have commented on this narrative
32 likesusers have liked this narrative
Trending Discussion
US
User on Tesla ·
This article completely disregards (ignores, forgets) how far China is in this field. If Tesla continues on this path, they will be fighting for their lives trying to sell $40000 dollar robots that can do less than a $10000 dollar one from China will do. Fair value of Tesla? It has always been a hype stock with a valuation completely unbased in reality. Your guess is as good as mine, but especially after the carbon credit scheme got canned, it is downwards of $150.
4
|0
US
User on Tesla ·
There is a lot of Musk's puffery being echoed in this article. "ecosystem dominance", Tesla certainly do not dominate any of their new markets. If Tesla is the undisputed leader of the premium "Closed Garden.", it is only through EV's and that business has been declining year-on-year, despite the market increasing. Vehicle manufactures are finding that customers are rejecting the subscription model. "The Cybercab fleet (launching 2026) acts as the financial bridge.", that is a stretch. Even if Level 4/5 autonomy is achieved, "profitability" still has to be proved, where the competition is not necessarily Waymo, but Uber. Taking the driver out of a ride‑hailing service may not be the killer saving people think it will be. Likewise, outside of CGI and for quite some time, an Optimus humanoid robot may prove more expensive and not as useful, versatile, skilled and knowledgeable as a domestic worker. Telsa may be withdrawing from the EV market, but for its other ventures, they have arrived late to the party, do not lead and show no sign that they will dominate any of them.
2
|0