Stock Analysis
- United States
- /
- Tech Hardware
- /
- NYSE:HPQ
HP's (NYSE:HPQ) five-year total shareholder returns outpace the underlying earnings growth
When you buy and hold a stock for the long term, you definitely want it to provide a positive return. Better yet, you'd like to see the share price move up more than the market average. But HP Inc. (NYSE:HPQ) has fallen short of that second goal, with a share price rise of 45% over five years, which is below the market return. Zooming in, the stock is actually down 1.4% in the last year.
Since the long term performance has been good but there's been a recent pullback of 3.5%, let's check if the fundamentals match the share price.
Check out our latest analysis for HP
While markets are a powerful pricing mechanism, share prices reflect investor sentiment, not just underlying business performance. One imperfect but simple way to consider how the market perception of a company has shifted is to compare the change in the earnings per share (EPS) with the share price movement.
Over half a decade, HP managed to grow its earnings per share at 5.8% a year. This EPS growth is slower than the share price growth of 8% per year, over the same period. This suggests that market participants hold the company in higher regard, these days. And that's hardly shocking given the track record of growth.
The graphic below depicts how EPS has changed over time (unveil the exact values by clicking on the image).
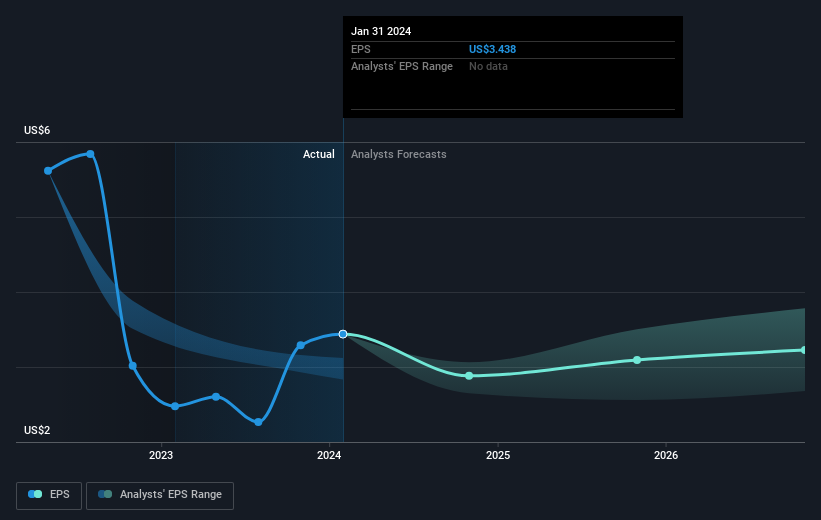
We know that HP has improved its bottom line lately, but is it going to grow revenue? Check if analysts think HP will grow revenue in the future.
What About Dividends?
As well as measuring the share price return, investors should also consider the total shareholder return (TSR). The TSR is a return calculation that accounts for the value of cash dividends (assuming that any dividend received was reinvested) and the calculated value of any discounted capital raisings and spin-offs. Arguably, the TSR gives a more comprehensive picture of the return generated by a stock. As it happens, HP's TSR for the last 5 years was 71%, which exceeds the share price return mentioned earlier. The dividends paid by the company have thusly boosted the total shareholder return.
A Different Perspective
HP shareholders gained a total return of 2.1% during the year. But that was short of the market average. On the bright side, the longer term returns (running at about 11% a year, over half a decade) look better. It may well be that this is a business worth popping on the watching, given the continuing positive reception, over time, from the market. It's always interesting to track share price performance over the longer term. But to understand HP better, we need to consider many other factors. Like risks, for instance. Every company has them, and we've spotted 5 warning signs for HP (of which 2 are potentially serious!) you should know about.
If you are like me, then you will not want to miss this free list of growing companies that insiders are buying.
Please note, the market returns quoted in this article reflect the market weighted average returns of stocks that currently trade on American exchanges.
Valuation is complex, but we're helping make it simple.
Find out whether HP is potentially over or undervalued by checking out our comprehensive analysis, which includes fair value estimates, risks and warnings, dividends, insider transactions and financial health.
View the Free AnalysisHave feedback on this article? Concerned about the content? Get in touch with us directly. Alternatively, email editorial-team (at) simplywallst.com.
This article by Simply Wall St is general in nature. We provide commentary based on historical data and analyst forecasts only using an unbiased methodology and our articles are not intended to be financial advice. It does not constitute a recommendation to buy or sell any stock, and does not take account of your objectives, or your financial situation. We aim to bring you long-term focused analysis driven by fundamental data. Note that our analysis may not factor in the latest price-sensitive company announcements or qualitative material. Simply Wall St has no position in any stocks mentioned.

Simply Wall St
About NYSE:HPQ
HP
HP Inc. provides personal computing and other digital access devices, imaging and printing products, and related technologies, solutions, and services worldwide.
Undervalued with proven track record and pays a dividend.
