Stock Analysis
- United States
- /
- Electrical
- /
- NYSE:HUBB
Hubbell's (NYSE:HUBB) five-year earnings growth trails the 29% YoY shareholder returns

When you buy shares in a company, it's worth keeping in mind the possibility that it could fail, and you could lose your money. But when you pick a company that is really flourishing, you can make more than 100%. Long term Hubbell Incorporated (NYSE:HUBB) shareholders would be well aware of this, since the stock is up 217% in five years. Also pleasing for shareholders was the 18% gain in the last three months.
Since it's been a strong week for Hubbell shareholders, let's have a look at trend of the longer term fundamentals.
Check out our latest analysis for Hubbell
While the efficient markets hypothesis continues to be taught by some, it has been proven that markets are over-reactive dynamic systems, and investors are not always rational. One way to examine how market sentiment has changed over time is to look at the interaction between a company's share price and its earnings per share (EPS).
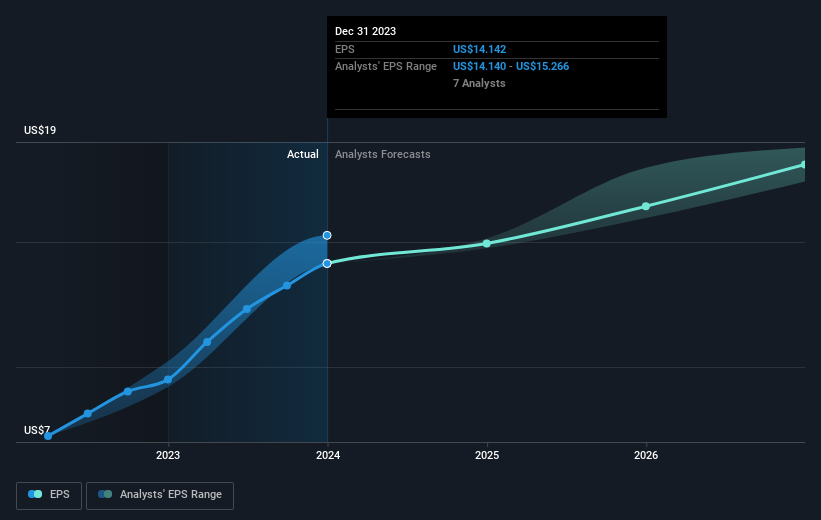
During five years of share price growth, Hubbell achieved compound earnings per share (EPS) growth of 17% per year. This EPS growth is slower than the share price growth of 26% per year, over the same period. So it's fair to assume the market has a higher opinion of the business than it did five years ago. And that's hardly shocking given the track record of growth.
The image below shows how EPS has tracked over time (if you click on the image you can see greater detail).
We like that insiders have been buying shares in the last twelve months. Even so, future earnings will be far more important to whether current shareholders make money. This free interactive report on Hubbell's earnings, revenue and cash flow is a great place to start, if you want to investigate the stock further.
What About Dividends?
It is important to consider the total shareholder return, as well as the share price return, for any given stock. Whereas the share price return only reflects the change in the share price, the TSR includes the value of dividends (assuming they were reinvested) and the benefit of any discounted capital raising or spin-off. Arguably, the TSR gives a more comprehensive picture of the return generated by a stock. As it happens, Hubbell's TSR for the last 5 years was 253%, which exceeds the share price return mentioned earlier. The dividends paid by the company have thusly boosted the total shareholder return.
A Different Perspective
We're pleased to report that Hubbell shareholders have received a total shareholder return of 51% over one year. Of course, that includes the dividend. That gain is better than the annual TSR over five years, which is 29%. Therefore it seems like sentiment around the company has been positive lately. In the best case scenario, this may hint at some real business momentum, implying that now could be a great time to delve deeper. While it is well worth considering the different impacts that market conditions can have on the share price, there are other factors that are even more important. Take risks, for example - Hubbell has 2 warning signs we think you should be aware of.
Hubbell is not the only stock that insiders are buying. For those who like to find winning investments this free list of growing companies with recent insider purchasing, could be just the ticket.
Please note, the market returns quoted in this article reflect the market weighted average returns of stocks that currently trade on American exchanges.
Valuation is complex, but we're helping make it simple.
Find out whether Hubbell is potentially over or undervalued by checking out our comprehensive analysis, which includes fair value estimates, risks and warnings, dividends, insider transactions and financial health.
View the Free AnalysisHave feedback on this article? Concerned about the content? Get in touch with us directly. Alternatively, email editorial-team (at) simplywallst.com.
This article by Simply Wall St is general in nature. We provide commentary based on historical data and analyst forecasts only using an unbiased methodology and our articles are not intended to be financial advice. It does not constitute a recommendation to buy or sell any stock, and does not take account of your objectives, or your financial situation. We aim to bring you long-term focused analysis driven by fundamental data. Note that our analysis may not factor in the latest price-sensitive company announcements or qualitative material. Simply Wall St has no position in any stocks mentioned.
About NYSE:HUBB
Hubbell
Designs, manufactures, and sells electrical and utility solutions in the United States and internationally.
Outstanding track record with adequate balance sheet and pays a dividend.

