CTS (NYSE:CTS) Could Easily Take On More Debt

David Iben put it well when he said, 'Volatility is not a risk we care about. What we care about is avoiding the permanent loss of capital.' It's only natural to consider a company's balance sheet when you examine how risky it is, since debt is often involved when a business collapses. We note that CTS Corporation (NYSE:CTS) does have debt on its balance sheet. But the real question is whether this debt is making the company risky.
What Risk Does Debt Bring?
Debt is a tool to help businesses grow, but if a business is incapable of paying off its lenders, then it exists at their mercy. Part and parcel of capitalism is the process of 'creative destruction' where failed businesses are mercilessly liquidated by their bankers. However, a more frequent (but still costly) occurrence is where a company must issue shares at bargain-basement prices, permanently diluting shareholders, just to shore up its balance sheet. Of course, plenty of companies use debt to fund growth, without any negative consequences. When we examine debt levels, we first consider both cash and debt levels, together.
Check out our latest analysis for CTS
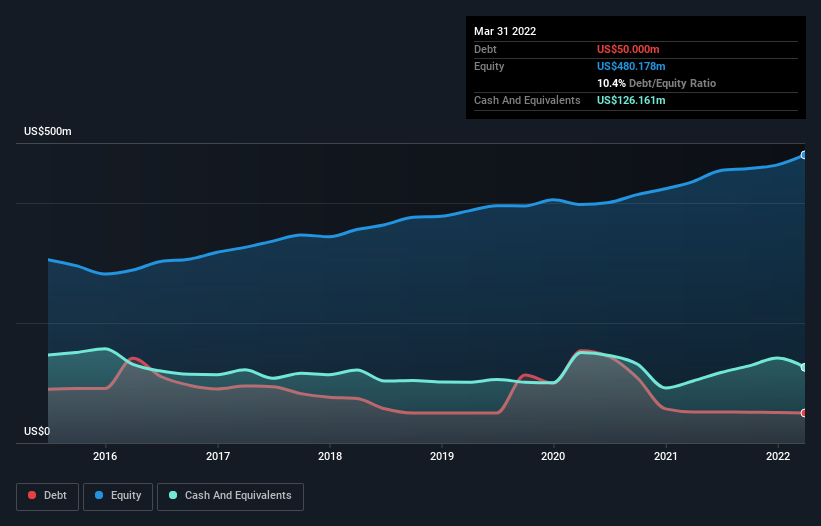
How Much Debt Does CTS Carry?
As you can see below, CTS had US$50.0m of debt, at March 2022, which is about the same as the year before. You can click the chart for greater detail. But it also has US$126.2m in cash to offset that, meaning it has US$76.2m net cash.
A Look At CTS' Liabilities
Zooming in on the latest balance sheet data, we can see that CTS had liabilities of US$115.0m due within 12 months and liabilities of US$89.5m due beyond that. On the other hand, it had cash of US$126.2m and US$95.1m worth of receivables due within a year. So it can boast US$16.7m more liquid assets than total liabilities.
Having regard to CTS' size, it seems that its liquid assets are well balanced with its total liabilities. So it's very unlikely that the US$1.13b company is short on cash, but still worth keeping an eye on the balance sheet. Succinctly put, CTS boasts net cash, so it's fair to say it does not have a heavy debt load!
In addition to that, we're happy to report that CTS has boosted its EBIT by 52%, thus reducing the spectre of future debt repayments. When analysing debt levels, the balance sheet is the obvious place to start. But it is future earnings, more than anything, that will determine CTS's ability to maintain a healthy balance sheet going forward. So if you want to see what the professionals think, you might find this free report on analyst profit forecasts to be interesting.
Finally, a company can only pay off debt with cold hard cash, not accounting profits. CTS may have net cash on the balance sheet, but it is still interesting to look at how well the business converts its earnings before interest and tax (EBIT) to free cash flow, because that will influence both its need for, and its capacity to manage debt. Over the last three years, CTS recorded free cash flow worth a fulsome 99% of its EBIT, which is stronger than we'd usually expect. That puts it in a very strong position to pay down debt.
Summing up
While we empathize with investors who find debt concerning, you should keep in mind that CTS has net cash of US$76.2m, as well as more liquid assets than liabilities. The cherry on top was that in converted 99% of that EBIT to free cash flow, bringing in US$68m. So is CTS's debt a risk? It doesn't seem so to us. Even though CTS lost money on the bottom line, its positive EBIT suggests the business itself has potential. So you might want to check out how earnings have been trending over the last few years.
At the end of the day, it's often better to focus on companies that are free from net debt. You can access our special list of such companies (all with a track record of profit growth). It's free.
The New Payments ETF Is Live on NASDAQ:
Money is moving to real-time rails, and a newly listed ETF now gives investors direct exposure. Fast settlement. Institutional custody. Simple access.
Explore how this launch could reshape portfolios
Sponsored ContentNew: AI Stock Screener & Alerts
Our new AI Stock Screener scans the market every day to uncover opportunities.
• Dividend Powerhouses (3%+ Yield)
• Undervalued Small Caps with Insider Buying
• High growth Tech and AI Companies
Or build your own from over 50 metrics.
Have feedback on this article? Concerned about the content? Get in touch with us directly. Alternatively, email editorial-team (at) simplywallst.com.
This article by Simply Wall St is general in nature. We provide commentary based on historical data and analyst forecasts only using an unbiased methodology and our articles are not intended to be financial advice. It does not constitute a recommendation to buy or sell any stock, and does not take account of your objectives, or your financial situation. We aim to bring you long-term focused analysis driven by fundamental data. Note that our analysis may not factor in the latest price-sensitive company announcements or qualitative material. Simply Wall St has no position in any stocks mentioned.
About NYSE:CTS
CTS
Designs, manufactures, and sells sensors, connectivity components, and actuators in North America, Europe, and Asia.
Flawless balance sheet and slightly overvalued.
Similar Companies
Market Insights

Weekly Picks

Early mover in a fast growing industry. Likely to experience share price volatility as they scale


A case for CA$31.80 (undiluted), aka 8,616% upside from CA$0.37 (an 86 bagger!).


Moderation and Stabilisation: HOLD: Fair Price based on a 4-year Cycle is $12.08
Recently Updated Narratives


Title: Market Sentiment Is Dead Wrong — Here's Why PSEC Deserves a Second Look


An amazing opportunity to potentially get a 100 bagger

Amazon: Why the World’s Biggest Platform Still Runs on Invisible Economics
Popular Narratives


Crazy Undervalued 42 Baggers Silver Play (Active & Running Mine)


MicroVision will explode future revenue by 380.37% with a vision towards success


NVDA: Expanding AI Demand Will Drive Major Data Center Investments Through 2026
Trending Discussion
