Advertisement
Does the Recent Share Pullback Offer a Fresh Opportunity in Belden for 2025?

Simply Wall St
Reviewed by Bailey Pemberton
Trying to figure out what to do with Belden stock right now? You are not alone. After all, in the past month the stock slid down 9.1%, and even pulled back 2.2% just in the last week. But context is everything. Zoom out, and you will see that Belden has actually returned 4.2% year-to-date, and an impressive 247.3% over the last five years. That kind of long-term growth can be hard to ignore, and it is making investors wonder if these recent dips are a buying opportunity or a warning sign.
So, why all the ups and downs? Some of the choppiness can be traced back to shifting market sentiment, as investors reassess the risks and rewards in the industrial tech sector. Recent moves in infrastructure spending and demand for secure network solutions sometimes spark optimism, even while broader market jitters seem to pull shares lower in the short term. For Belden, that means price swings do not always reflect business fundamentals.
The real question is how all of this translates into value. On that front, Belden currently boasts a value score of 5, meaning it checks the box as undervalued in five out of six key areas that analysts watch. That is worth a closer look.
Next up, we will dig into the different ways investors assess what a company like Belden is actually worth, and then share the single best approach to finding value. This can help you decide if Belden deserves a spot in your portfolio.
Why Belden is lagging behind its peers
Approach 1: Belden Discounted Cash Flow (DCF) Analysis
A Discounted Cash Flow (DCF) model estimates a company's intrinsic value by projecting its future cash flows and discounting them back to today. This approach evaluates what Belden is worth based solely on its ability to generate cash in the years ahead.
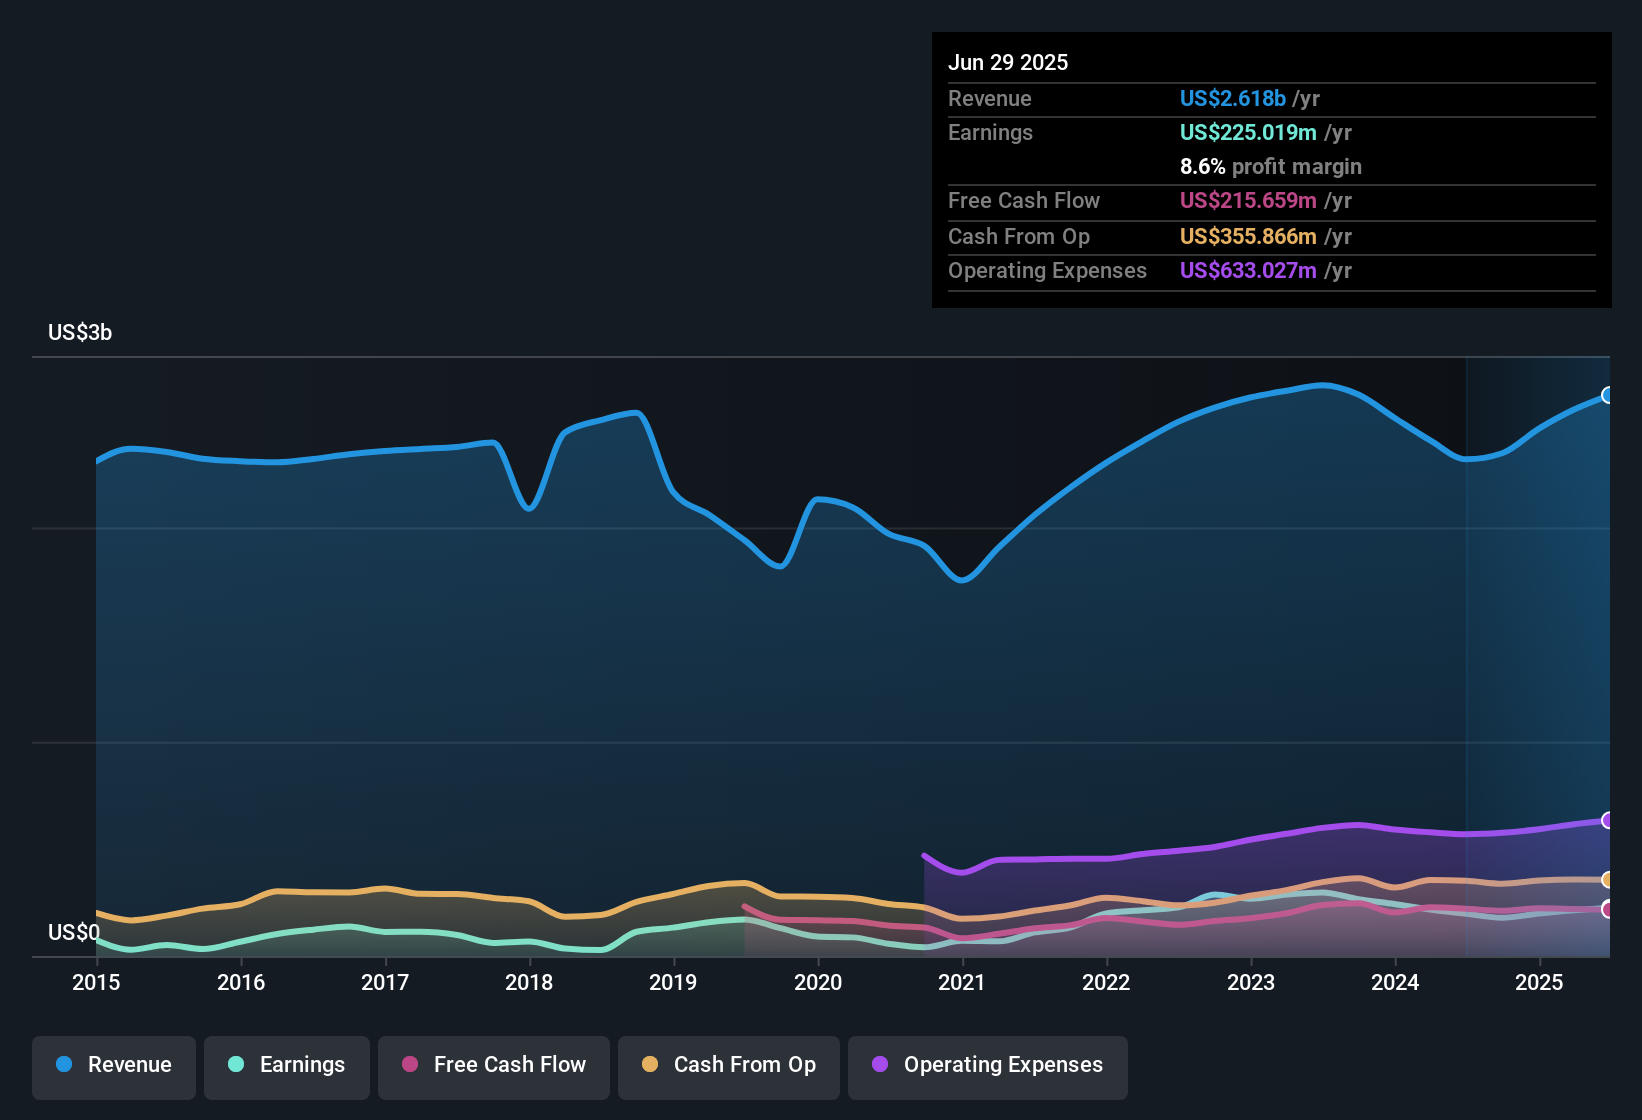
For Belden, the latest reported Free Cash Flow (FCF) stands at $225.9 million. Analysts forecast that this will continue to grow steadily, with projections reaching about $415.4 million by 2035, according to estimates that gradually taper growth over the next decade. These figures reflect both near-term analyst expectations and longer-term projections provided by models such as those from Simply Wall St.
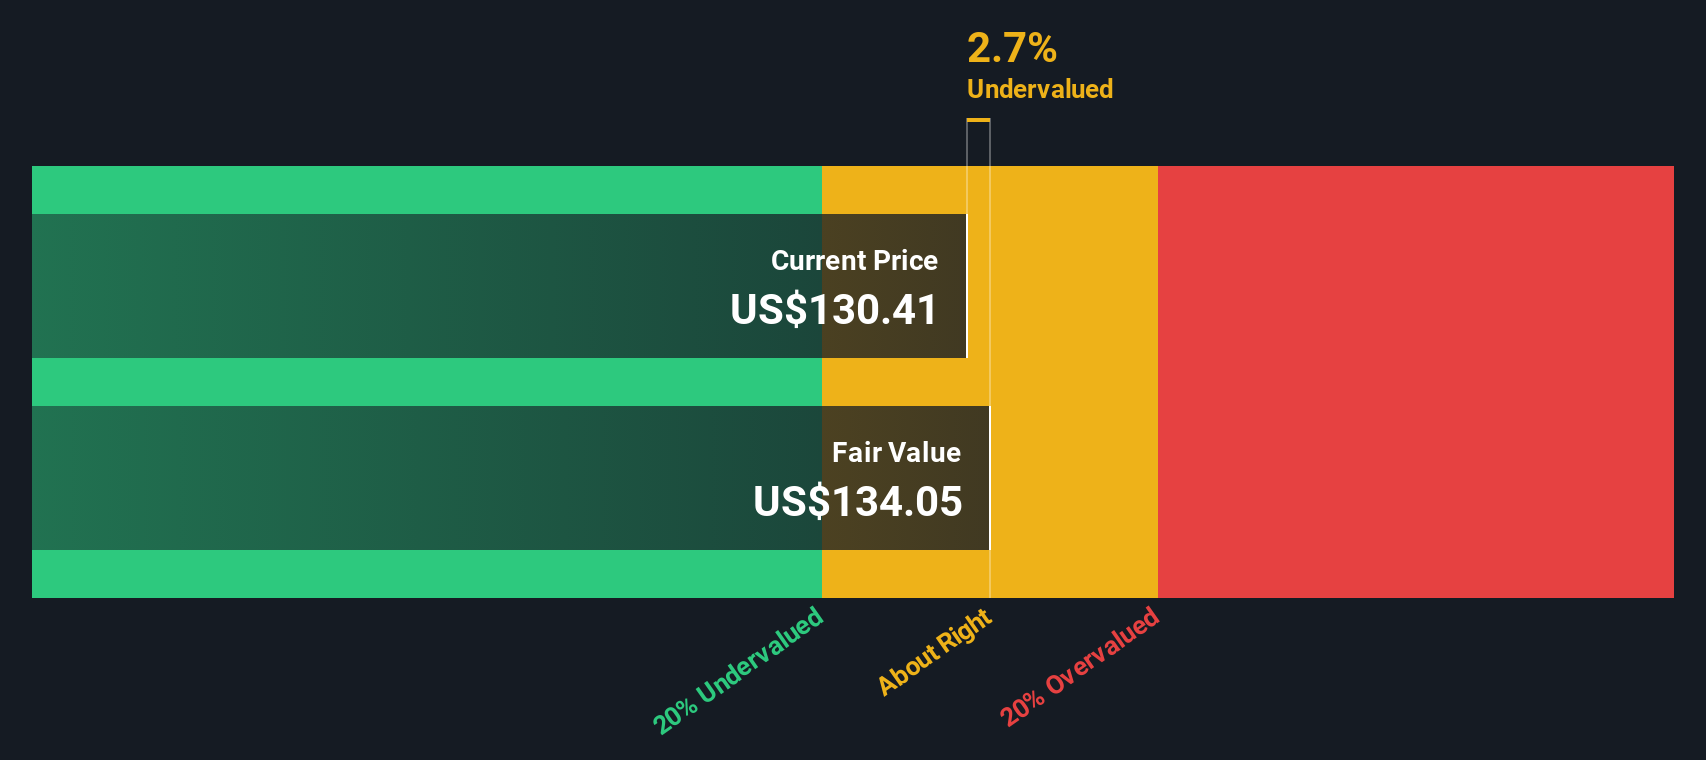
The DCF method combines all these projected cash flows, discounts them according to risk and time, and arrives at an estimated fair value for Belden's shares of $130.90. When compared to the current market price, the DCF analysis suggests the stock is 9.9% undervalued. In other words, based on these cash flow projections, Belden may be trading at a modest discount relative to what the model determines as fair value.
Result: ABOUT RIGHT
Simply Wall St performs a valuation analysis on every stock in the world every day (check out Belden's valuation analysis). We show the entire calculation in full. You can track the result in your watchlist or portfolio and be alerted when this changes.
Approach 2: Belden Price vs Earnings (PE)
For profitable companies like Belden, the Price-to-Earnings (PE) ratio is one of the most widely used valuation metrics. It tells investors how much they are paying for each dollar of the company’s earnings. The PE ratio is especially relevant when a business has a solid track record of profitability, as it gives a quick snapshot of whether the stock might be expensive or cheap relative to its earnings power.
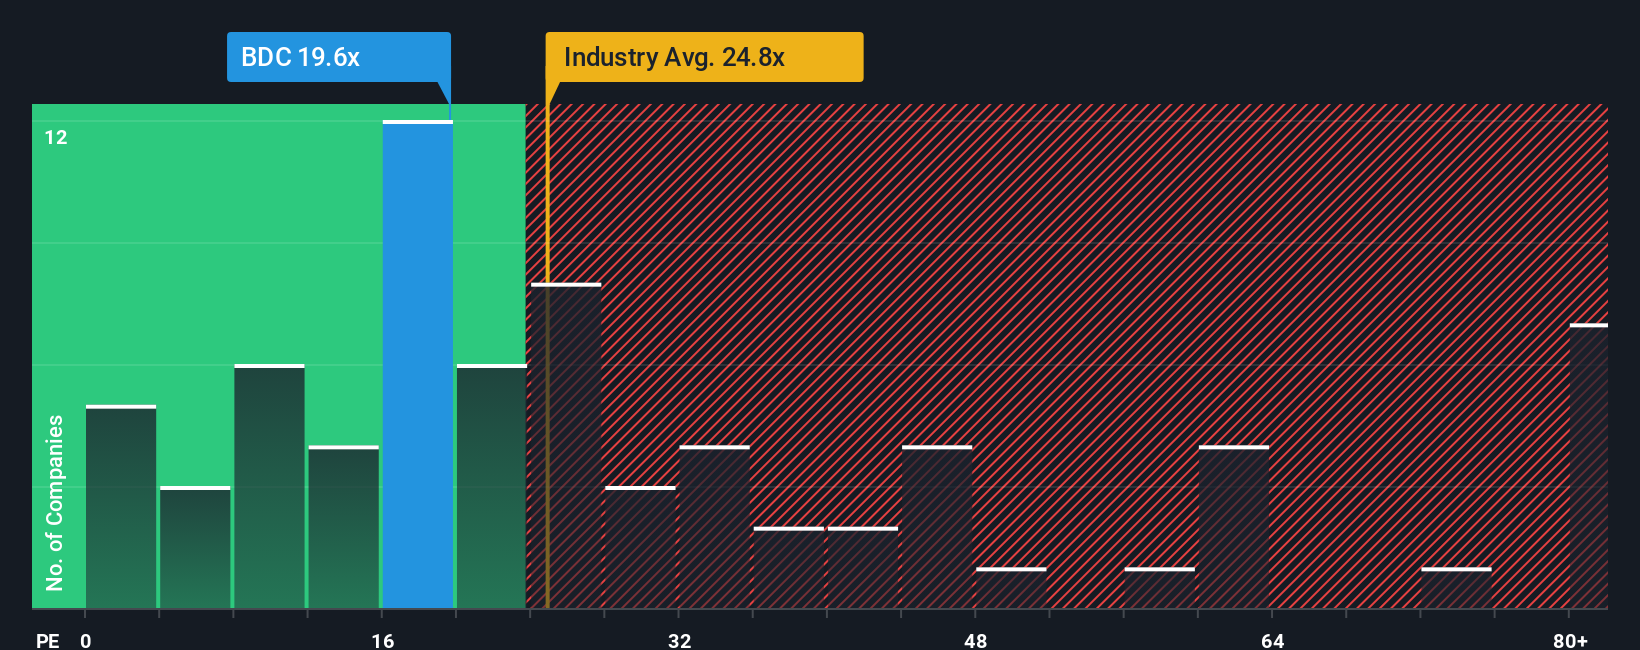
Of course, what counts as a "normal" or "fair" PE ratio depends on several factors. Companies with stronger growth prospects tend to trade at higher multiples, while those exposed to greater risks or weaker growth might deserve a discount. Generally, comparing PE to benchmarks like the industry average and key peers helps provide this context. Currently, Belden trades at 20.8x earnings, below both the electronic industry average of 24.0x and well below the peer group’s average of 63.0x. This suggests a reasonable valuation on the surface.
However, Simply Wall St’s “Fair Ratio” goes further. It calculates the appropriate earnings multiple by factoring in Belden’s expected earnings growth, profit margins, market cap, and risk profile, as well as its industry dynamics. This holistic approach gives a more tailored view than basic peer or industry comparisons. For Belden, the Fair Ratio is 24.3x compared to its actual PE of 20.8x, a gap of less than 0.10x. This indicates that the stock is trading almost exactly where the deeper analysis thinks it should be.
Result: ABOUT RIGHT
PE ratios tell one story, but what if the real opportunity lies elsewhere? Discover companies where insiders are betting big on explosive growth.
Upgrade Your Decision Making: Choose your Belden Narrative
Earlier we mentioned that there's an even better way to understand valuation, so let's introduce you to Narratives. A Narrative is a simple, powerful story you create about a company, tying together your assumptions for future revenue, earnings and margins to form a fair value that reflects your unique perspective beyond raw data or consensus numbers.
With Narratives, your outlook is directly linked to a personalized financial forecast and a fair value, making it easy to see whether Belden is a buy, hold or sell based on your beliefs. Narratives are available to everyone on Simply Wall St’s Community page, so anyone can draft, share, or refine these living stories, making complex investment decisions more approachable for millions of investors.
What makes Narratives stand out is their dynamic nature, as they automatically update in response to new news, earnings, or sudden changes in the market. This ensures your decisions are always built on the latest information.
For example, one investor might see Belden’s investments in software and network security fueling above-industry growth and push their estimated fair value to $150, while another could be more cautious about integration risks and set their target closer to $120. Narratives help you compare these viewpoints, sense-check consensus, and take action when your fair value is meaningfully different from today’s market price.
Do you think there's more to the story for Belden? Create your own Narrative to let the Community know!
This article by Simply Wall St is general in nature. We provide commentary based on historical data and analyst forecasts only using an unbiased methodology and our articles are not intended to be financial advice. It does not constitute a recommendation to buy or sell any stock, and does not take account of your objectives, or your financial situation. We aim to bring you long-term focused analysis driven by fundamental data. Note that our analysis may not factor in the latest price-sensitive company announcements or qualitative material. Simply Wall St has no position in any stocks mentioned.
Valuation is complex, but we're here to simplify it.
Discover if Belden might be undervalued or overvalued with our detailed analysis, featuring fair value estimates, potential risks, dividends, insider trades, and its financial condition.
Access Free AnalysisHave feedback on this article? Concerned about the content? Get in touch with us directly. Alternatively, email editorial-team@simplywallst.com
About NYSE:BDC
Belden
Provides connection solutions to bring data infrastructure into alignment to unlock new possibilities for its customers.
Undervalued with solid track record.
Similar Companies
Market Insights


Advertisement
Weekly Picks
AL

AlexLovell on Rocket Lab ·
Early mover in a fast growing industry. Likely to experience share price volatility as they scale
Fair Value:US$16.25380.9% overvalued
69 followersusers have followed this narrative
1 commentusers have commented on this narrative
18 likesusers have liked this narrative
AG


Agricola on Excellon Resources ·
A case for CA$31.80 (undiluted), aka 8,616% upside from CA$0.37 (an 86 bagger!).
Fair Value:CA$31.898.4% undervalued
69 followersusers have followed this narrative
10 commentsusers have commented on this narrative
20 likesusers have liked this narrative
FU


FundamentallySarcastic on Credit Corp Group ·
Moderation and Stabilisation: HOLD: Fair Price based on a 4-year Cycle is $12.08
Fair Value:AU$12.6411.0% overvalued
11 followersusers have followed this narrative
1 commentusers have commented on this narrative
0 likesusers have liked this narrative
Recently Updated Narratives
BA

bactrian on Novo Nordisk ·
A Quality Compounder Marked Down on Overblown Fears
Fair Value:US$9542.0% undervalued
95 followersusers have followed this narrative
8 commentsusers have commented on this narrative
0 likesusers have liked this narrative
YI

yiannisz on Etsy ·
Etsy Stock: Defending Differentiation in a World of Infinite Marketplaces
Fair Value:US$64.459.1% undervalued
4 followersusers have followed this narrative
0 commentsusers have commented on this narrative
0 likesusers have liked this narrative
YI

yiannisz on Align Technology ·
Align Technology Stock: Premium Orthodontics in a Cost-Sensitive World
Fair Value:US$154.623.6% overvalued
1 followerusers have followed this narrative
0 commentsusers have commented on this narrative
0 likesusers have liked this narrative
Popular Narratives
AG
Agricola on Excellon Resources ·
A case for CA$31.80 (undiluted), aka 8,616% upside from CA$0.37 (an 86 bagger!).
Fair Value:CA$31.898.4% undervalued
69 followersusers have followed this narrative
10 commentsusers have commented on this narrative
20 likesusers have liked this narrative
AL
AlexLovell on Rocket Lab ·
Early mover in a fast growing industry. Likely to experience share price volatility as they scale
Fair Value:US$16.25380.9% overvalued
69 followersusers have followed this narrative
1 commentusers have commented on this narrative
18 likesusers have liked this narrative
AN


AnalystConsensusTarget on NVIDIA ·
NVDA: Expanding AI Demand Will Drive Major Data Center Investments Through 2026
Fair Value:US$253.0225.6% undervalued
1020 followersusers have followed this narrative
6 commentsusers have commented on this narrative
28 likesusers have liked this narrative
Trending Discussion

ST
StevenM on Excellon Resources ·
Interesting analysis, but the price trajectory assumed for the baseline metals is problematic. These assumptions form the foundation for the entire case, and when compared against historical pricing, don’t appear to be grounded in any reasonable precedent. Even accounting for past commodity super-cycles, inflationary periods, or supply constraints, the forecasted pricing for gold, silver, zinc, and lead are well outside what history would suggest is plausible over comparable timeframes. That creates a fragile premise as the conclusions are driven by aggressive inputs rather than underlying market behavior that is realistic. The analysis would be materially stronger if the price assumptions were anchored to historical ranges and prior cycle peaks, with explicit rationale where the model intentionally departs from those patterns. As it stands, the trajectory feels more aspirational than analytical.
1
|1