Advertisement
Examining Arrow Electronics After This Year’s 9.3% Dip and Shifting Industry Dynamics

Simply Wall St
Reviewed by Bailey Pemberton
Thinking about whether to hold, buy, or move on from Arrow Electronics? You’re not alone. After all, it’s been a somewhat bumpy ride for Arrow shareholders lately. Even though the stock closed at $120.07 recently, it has retreated about 1.5% over the past month and is still down 9.3% for the year. That said, it’s posted gains of 7.8% year-to-date, and if you zoom out to the past three or five years, you’ll find solid returns of 20.8% and 56.9%, respectively. That is enough of a track record to pique anyone’s curiosity about what’s driving the action and whether there is real opportunity here.
In recent months, much of the buzz around Arrow Electronics has focused on shifts in global supply chain dynamics and evolving demand for electronic components. Ongoing headlines about efforts to optimize distribution networks and adjust to rapid technological change have continued to shape both investor sentiment and the company’s underlying risk profile. These factors have played into recent share price moves, reflecting a market that is wrestling with Arrow’s prospects amid industry-wide transformation.
If you’re considering Arrow Electronics as a potential value play, here’s a key figure: the company scores a 3 out of 6 on a standard value assessment, indicating it is undervalued by several common checks, but not across the board. So, is Arrow a hidden bargain or just fairly priced? Let’s break down those valuation approaches to see what the numbers (and maybe something more) have to say.
Why Arrow Electronics is lagging behind its peers
Approach 1: Arrow Electronics Discounted Cash Flow (DCF) Analysis
The Discounted Cash Flow (DCF) model estimates a company's intrinsic value by forecasting its future cash flows and discounting them back to today’s dollars. The underlying idea is to assess what all those future cash flows are really worth right now, giving investors a benchmark for fair value.
For Arrow Electronics, the current Free Cash Flow (FCF) is $473 Million. According to projections, this figure is expected to decrease substantially over the coming years, with free cash flow in 2035 estimated at roughly $59 Million. Most analyst-driven forecasts are provided for the next five years. For longer horizons, further estimates are extrapolated based on recent trends. These projections suggest ongoing challenges with consistent FCF growth.
Based on these forecasts, Arrow Electronics has an estimated intrinsic value of $19.18 per share using this DCF model. With the current share price sitting at $120.07, the DCF approach implies that the stock is around 526% overvalued compared to its calculated fair value.
Result: OVERVALUED
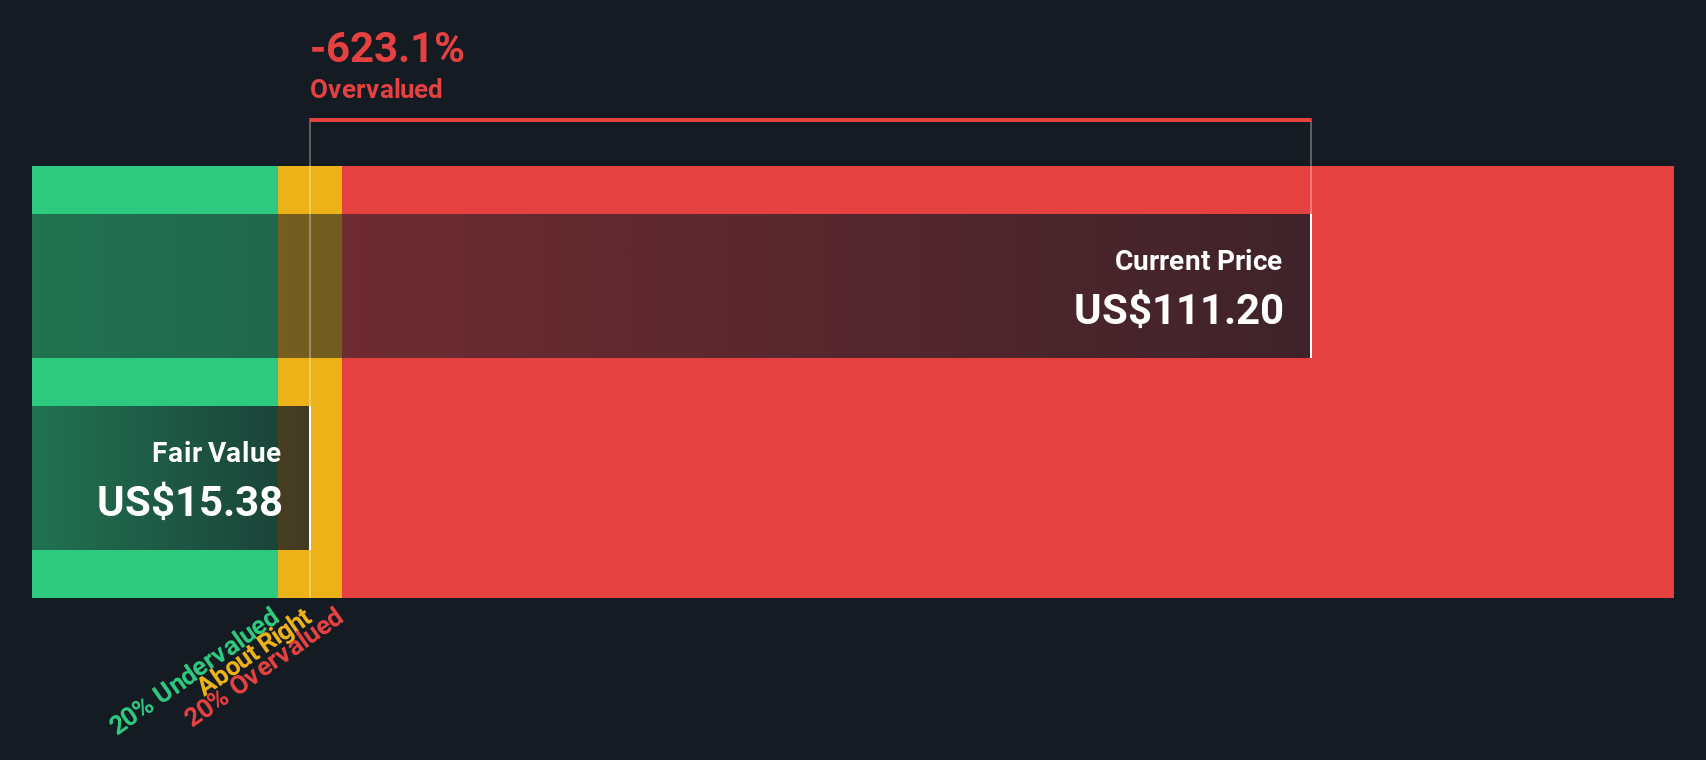
Our Discounted Cash Flow (DCF) analysis suggests Arrow Electronics may be overvalued by 526.0%. Find undervalued stocks or create your own screener to find better value opportunities.
Approach 2: Arrow Electronics Price vs Earnings
The price-to-earnings (PE) ratio is a popular valuation measure for profitable companies like Arrow Electronics because it tells you how much investors are willing to pay for every dollar of earnings the business generates. When a company has steady profits, this ratio offers a clear snapshot of how the market views its growth prospects versus its inherent risks.
What is considered a reasonable PE ratio varies based on expected growth and risk. If investors believe a company is set to grow earnings rapidly or faces little risk, they are often willing to pay a higher multiple. On the other hand, if growth is expected to slow or risks are elevated, the typical PE will usually be lower compared to peers or the broader market.
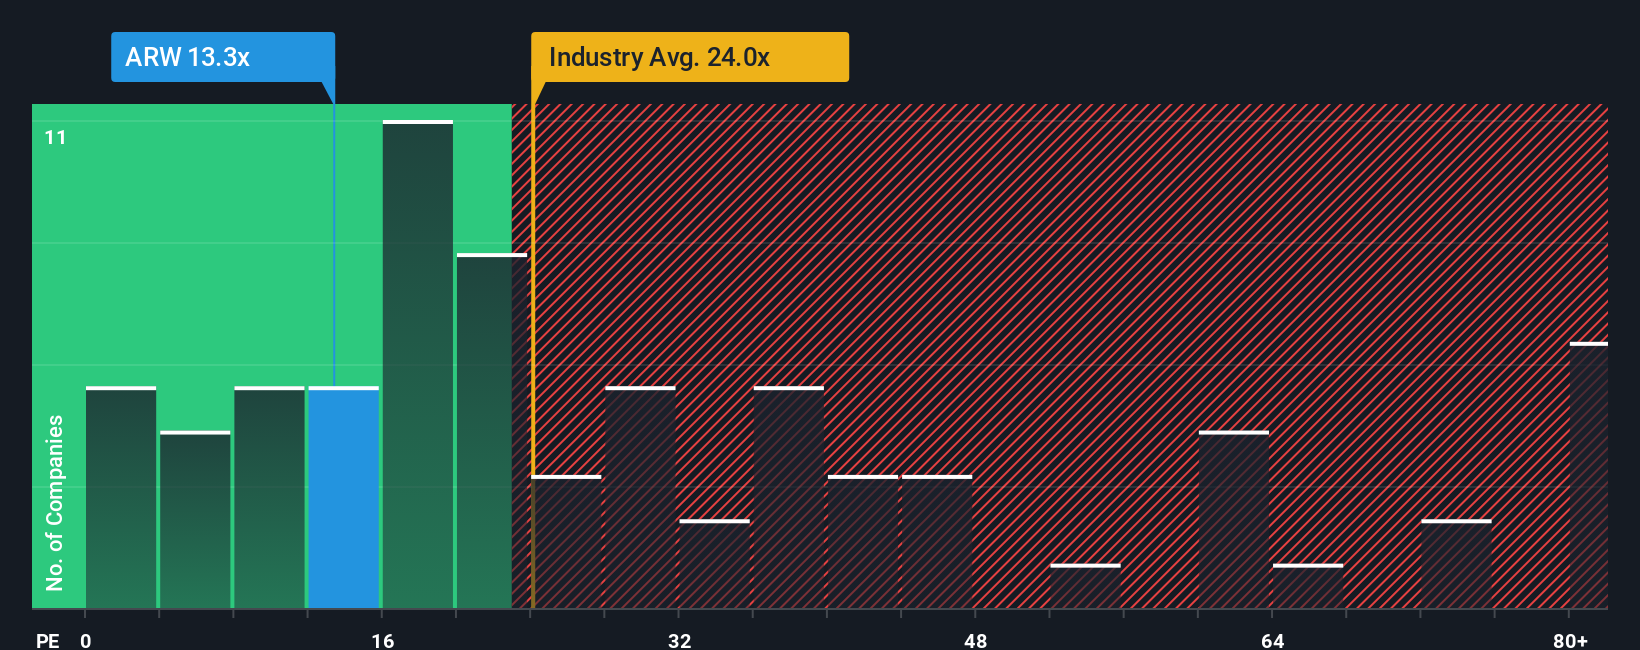
Arrow Electronics currently trades at a PE ratio of 13.2x. That is significantly below the electronic industry average of 25.8x and also less than the peer average of 18.8x. While comparing PE ratios to industry benchmarks provides some context, Simply Wall St’s proprietary Fair Ratio offers a more refined reference point. The Fair Ratio, which is 27.2x for Arrow, integrates not just industry averages but also factors like the company’s unique growth trajectory, profit margins, risk profile, and market cap. Because it is tailored to Arrow’s specific situation, the Fair Ratio is a more precise gauge than generic peer or industry multiples.
Comparing Arrow’s actual PE ratio (13.2x) to its Fair Ratio of 27.2x, the stock currently looks undervalued on this basis.
Result: UNDERVALUED
PE ratios tell one story, but what if the real opportunity lies elsewhere? Discover companies where insiders are betting big on explosive growth.
Upgrade Your Decision Making: Choose your Arrow Electronics Narrative
Earlier we mentioned that there is an even better way to understand valuation, so let's introduce you to Narratives. A Narrative is simply your story about a company—a perspective that combines your views about Arrow Electronics' business, its future revenue, margins, and what you believe is a fair value for the stock.
Narratives let you move beyond just numbers and ratios by linking the company’s story directly to a financial forecast and the resulting fair value, making your investment decisions feel more personal and insightful.
On Simply Wall St's platform, Narratives are a practical and easy-to-use tool accessible via the Community page, trusted by millions of investors to help make sense of a company’s potential.
By building and following Narratives, you can quickly see how your fair value estimate stacks up against Arrow's share price. This helps you decide if it is time to buy, hold, or sell based on your own reasoning rather than just analyst consensus or formulas.
Best of all, Narratives update automatically when new information like news or earnings arrives, so you always have a fresh, relevant view of where things stand.
For example, some investors currently set Arrow Electronics’ fair value at $98, viewing risks like industry disruption as significant, while others are more optimistic at $135, focusing on electrification growth and recurring revenues. This illustrates how different stories lead to different investment decisions.
Do you think there's more to the story for Arrow Electronics? Create your own Narrative to let the Community know!
This article by Simply Wall St is general in nature. We provide commentary based on historical data and analyst forecasts only using an unbiased methodology and our articles are not intended to be financial advice. It does not constitute a recommendation to buy or sell any stock, and does not take account of your objectives, or your financial situation. We aim to bring you long-term focused analysis driven by fundamental data. Note that our analysis may not factor in the latest price-sensitive company announcements or qualitative material. Simply Wall St has no position in any stocks mentioned.
New: Manage All Your Stock Portfolios in One Place
We've created the ultimate portfolio companion for stock investors, and it's free.
• Connect an unlimited number of Portfolios and see your total in one currency
• Be alerted to new Warning Signs or Risks via email or mobile
• Track the Fair Value of your stocks
Have feedback on this article? Concerned about the content? Get in touch with us directly. Alternatively, email editorial-team@simplywallst.com
About NYSE:ARW
Arrow Electronics
Provides products, services, and solutions to industrial and commercial users of electronic components and enterprise computing solutions in the Americas, Europe, the Middle East, Africa, and the Asia Pacific.
Fair value with mediocre balance sheet.
Similar Companies
Market Insights

Advertisement
Community Narratives
Finding The True Value Of A Logistics Powerhouse
Fair Value US$95.21|8.5% undervalued
NV
Community Contributor
Paradigm Biopharmaceuticals Will Lead Osteoarthritis Treatment with Zilosul's FDA Success
Fair Value AU$5.50|91.8% undervalued
AM
Community Contributor
Barrick Mining (ABX:CA): A Gold Hedge against a U.S. Shutdown
Fair Value CA$60.00|26.5% undervalued
GM
Community Contributor