Arrow Electronics, Inc. (NYSE:ARW) Shares Could Be 29% Above Their Intrinsic Value Estimate

Key Insights
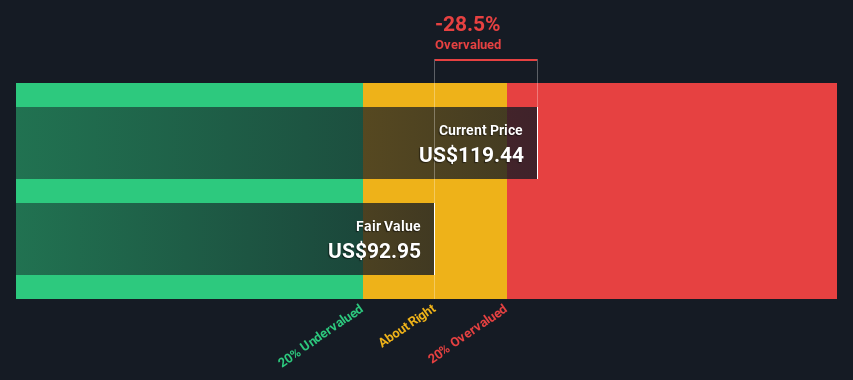
- Using the 2 Stage Free Cash Flow to Equity, Arrow Electronics fair value estimate is US$92.95
- Arrow Electronics is estimated to be 29% overvalued based on current share price of US$119
- Analyst price target for ARW is US$129, which is 38% above our fair value estimate
How far off is Arrow Electronics, Inc. (NYSE:ARW) from its intrinsic value? Using the most recent financial data, we'll take a look at whether the stock is fairly priced by taking the forecast future cash flows of the company and discounting them back to today's value. We will take advantage of the Discounted Cash Flow (DCF) model for this purpose. Don't get put off by the jargon, the math behind it is actually quite straightforward.
We generally believe that a company's value is the present value of all of the cash it will generate in the future. However, a DCF is just one valuation metric among many, and it is not without flaws. For those who are keen learners of equity analysis, the Simply Wall St analysis model here may be something of interest to you.
Check out our latest analysis for Arrow Electronics
The Method
We're using the 2-stage growth model, which simply means we take in account two stages of company's growth. In the initial period the company may have a higher growth rate and the second stage is usually assumed to have a stable growth rate. In the first stage we need to estimate the cash flows to the business over the next ten years. Seeing as no analyst estimates of free cash flow are available to us, we have extrapolate the previous free cash flow (FCF) from the company's last reported value. We assume companies with shrinking free cash flow will slow their rate of shrinkage, and that companies with growing free cash flow will see their growth rate slow, over this period. We do this to reflect that growth tends to slow more in the early years than it does in later years.
A DCF is all about the idea that a dollar in the future is less valuable than a dollar today, so we discount the value of these future cash flows to their estimated value in today's dollars:
10-year free cash flow (FCF) estimate
| 2024 | 2025 | 2026 | 2027 | 2028 | 2029 | 2030 | 2031 | 2032 | 2033 | |
| Levered FCF ($, Millions) | US$419.2m | US$405.7m | US$399.2m | US$397.4m | US$398.7m | US$402.4m | US$407.6m | US$414.0m | US$421.4m | US$429.4m |
| Growth Rate Estimate Source | Est @ -5.58% | Est @ -3.24% | Est @ -1.60% | Est @ -0.45% | Est @ 0.35% | Est @ 0.91% | Est @ 1.30% | Est @ 1.58% | Est @ 1.77% | Est @ 1.91% |
| Present Value ($, Millions) Discounted @ 9.4% | US$383 | US$339 | US$304 | US$277 | US$254 | US$234 | US$217 | US$201 | US$187 | US$174 |
("Est" = FCF growth rate estimated by Simply Wall St)
Present Value of 10-year Cash Flow (PVCF) = US$2.6b
We now need to calculate the Terminal Value, which accounts for all the future cash flows after this ten year period. For a number of reasons a very conservative growth rate is used that cannot exceed that of a country's GDP growth. In this case we have used the 5-year average of the 10-year government bond yield (2.2%) to estimate future growth. In the same way as with the 10-year 'growth' period, we discount future cash flows to today's value, using a cost of equity of 9.4%.
Terminal Value (TV)= FCF2033 × (1 + g) ÷ (r – g) = US$429m× (1 + 2.2%) ÷ (9.4%– 2.2%) = US$6.1b
Present Value of Terminal Value (PVTV)= TV / (1 + r)10= US$6.1b÷ ( 1 + 9.4%)10= US$2.5b
The total value, or equity value, is then the sum of the present value of the future cash flows, which in this case is US$5.0b. To get the intrinsic value per share, we divide this by the total number of shares outstanding. Relative to the current share price of US$119, the company appears slightly overvalued at the time of writing. Remember though, that this is just an approximate valuation, and like any complex formula - garbage in, garbage out.
Important Assumptions
Now the most important inputs to a discounted cash flow are the discount rate, and of course, the actual cash flows. If you don't agree with these result, have a go at the calculation yourself and play with the assumptions. The DCF also does not consider the possible cyclicality of an industry, or a company's future capital requirements, so it does not give a full picture of a company's potential performance. Given that we are looking at Arrow Electronics as potential shareholders, the cost of equity is used as the discount rate, rather than the cost of capital (or weighted average cost of capital, WACC) which accounts for debt. In this calculation we've used 9.4%, which is based on a levered beta of 1.445. Beta is a measure of a stock's volatility, compared to the market as a whole. We get our beta from the industry average beta of globally comparable companies, with an imposed limit between 0.8 and 2.0, which is a reasonable range for a stable business.
SWOT Analysis for Arrow Electronics
- Debt is well covered by earnings.
- Earnings declined over the past year.
- Good value based on P/E ratio compared to estimated Fair P/E ratio.
- Debt is not well covered by operating cash flow.
- Annual earnings are forecast to decline for the next 2 years.
Looking Ahead:
Valuation is only one side of the coin in terms of building your investment thesis, and it ideally won't be the sole piece of analysis you scrutinize for a company. It's not possible to obtain a foolproof valuation with a DCF model. Preferably you'd apply different cases and assumptions and see how they would impact the company's valuation. If a company grows at a different rate, or if its cost of equity or risk free rate changes sharply, the output can look very different. What is the reason for the share price exceeding the intrinsic value? For Arrow Electronics, we've compiled three pertinent elements you should further research:
- Risks: Take risks, for example - Arrow Electronics has 2 warning signs we think you should be aware of.
- Future Earnings: How does ARW's growth rate compare to its peers and the wider market? Dig deeper into the analyst consensus number for the upcoming years by interacting with our free analyst growth expectation chart.
- Other High Quality Alternatives: Do you like a good all-rounder? Explore our interactive list of high quality stocks to get an idea of what else is out there you may be missing!
PS. Simply Wall St updates its DCF calculation for every American stock every day, so if you want to find the intrinsic value of any other stock just search here.
If you're looking to trade Arrow Electronics, open an account with the lowest-cost platform trusted by professionals, Interactive Brokers.
With clients in over 200 countries and territories, and access to 160 markets, IBKR lets you trade stocks, options, futures, forex, bonds and funds from a single integrated account.
Enjoy no hidden fees, no account minimums, and FX conversion rates as low as 0.03%, far better than what most brokers offer.
Sponsored ContentNew: Manage All Your Stock Portfolios in One Place
We've created the ultimate portfolio companion for stock investors, and it's free.
• Connect an unlimited number of Portfolios and see your total in one currency
• Be alerted to new Warning Signs or Risks via email or mobile
• Track the Fair Value of your stocks
Have feedback on this article? Concerned about the content? Get in touch with us directly. Alternatively, email editorial-team (at) simplywallst.com.
This article by Simply Wall St is general in nature. We provide commentary based on historical data and analyst forecasts only using an unbiased methodology and our articles are not intended to be financial advice. It does not constitute a recommendation to buy or sell any stock, and does not take account of your objectives, or your financial situation. We aim to bring you long-term focused analysis driven by fundamental data. Note that our analysis may not factor in the latest price-sensitive company announcements or qualitative material. Simply Wall St has no position in any stocks mentioned.
About NYSE:ARW
Arrow Electronics
Provides products, services, and solutions to industrial and commercial users of electronic components and enterprise computing solutions in the Americas, Europe, the Middle East, Africa, and the Asia Pacific.
Undervalued with excellent balance sheet.
Similar Companies
Market Insights

Community Narratives

