
Advertisement
- United States
- /
- Electronic Equipment and Components
- /
- NasdaqGM:SNT
Senstar Technologies Corporation's (NASDAQ:SNT) Stock On An Uptrend: Could Fundamentals Be Driving The Momentum?

Most readers would already be aware that Senstar Technologies' (NASDAQ:SNT) stock increased significantly by 31% over the past three months. Given that stock prices are usually aligned with a company's financial performance in the long-term, we decided to study its financial indicators more closely to see if they had a hand to play in the recent price move. Specifically, we decided to study Senstar Technologies' ROE in this article.
Return on Equity or ROE is a test of how effectively a company is growing its value and managing investors’ money. In short, ROE shows the profit each dollar generates with respect to its shareholder investments.
See our latest analysis for Senstar Technologies
How To Calculate Return On Equity?
The formula for ROE is:
Return on Equity = Net Profit (from continuing operations) ÷ Shareholders' Equity
So, based on the above formula, the ROE for Senstar Technologies is:
3.9% = US$1.5m ÷ US$38m (Based on the trailing twelve months to September 2024).
The 'return' is the profit over the last twelve months. That means that for every $1 worth of shareholders' equity, the company generated $0.04 in profit.
What Is The Relationship Between ROE And Earnings Growth?
So far, we've learned that ROE is a measure of a company's profitability. We now need to evaluate how much profit the company reinvests or "retains" for future growth which then gives us an idea about the growth potential of the company. Assuming everything else remains unchanged, the higher the ROE and profit retention, the higher the growth rate of a company compared to companies that don't necessarily bear these characteristics.
A Side By Side comparison of Senstar Technologies' Earnings Growth And 3.9% ROE
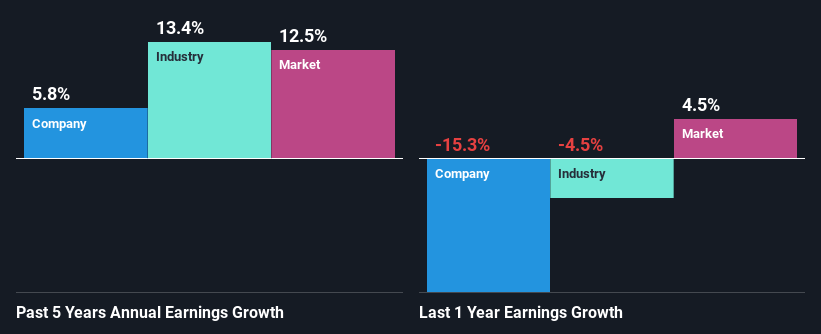
It is hard to argue that Senstar Technologies' ROE is much good in and of itself. Even compared to the average industry ROE of 10%, the company's ROE is quite dismal. However, the moderate 5.8% net income growth seen by Senstar Technologies over the past five years is definitely a positive. We reckon that there could be other factors at play here. For instance, the company has a low payout ratio or is being managed efficiently.
We then compared Senstar Technologies' net income growth with the industry and found that the company's growth figure is lower than the average industry growth rate of 13% in the same 5-year period, which is a bit concerning.
The basis for attaching value to a company is, to a great extent, tied to its earnings growth. What investors need to determine next is if the expected earnings growth, or the lack of it, is already built into the share price. By doing so, they will have an idea if the stock is headed into clear blue waters or if swampy waters await. One good indicator of expected earnings growth is the P/E ratio which determines the price the market is willing to pay for a stock based on its earnings prospects. So, you may want to check if Senstar Technologies is trading on a high P/E or a low P/E, relative to its industry.
Is Senstar Technologies Using Its Retained Earnings Effectively?
Senstar Technologies doesn't pay any regular dividends currently which essentially means that it has been reinvesting all of its profits into the business. This definitely contributes to the decent earnings growth number that we discussed above.
Conclusion
On the whole, we do feel that Senstar Technologies has some positive attributes. Namely, its respectable earnings growth, which it achieved due to it retaining most of its profits. However, given the low ROE, investors may not be benefitting from all that reinvestment after all. While we won't completely dismiss the company, what we would do, is try to ascertain how risky the business is to make a more informed decision around the company. To know the 1 risk we have identified for Senstar Technologies visit our risks dashboard for free.
New: Manage All Your Stock Portfolios in One Place
We've created the ultimate portfolio companion for stock investors, and it's free.
• Connect an unlimited number of Portfolios and see your total in one currency
• Be alerted to new Warning Signs or Risks via email or mobile
• Track the Fair Value of your stocks
Have feedback on this article? Concerned about the content? Get in touch with us directly. Alternatively, email editorial-team (at) simplywallst.com.
This article by Simply Wall St is general in nature. We provide commentary based on historical data and analyst forecasts only using an unbiased methodology and our articles are not intended to be financial advice. It does not constitute a recommendation to buy or sell any stock, and does not take account of your objectives, or your financial situation. We aim to bring you long-term focused analysis driven by fundamental data. Note that our analysis may not factor in the latest price-sensitive company announcements or qualitative material. Simply Wall St has no position in any stocks mentioned.
About NasdaqGM:SNT
Senstar Technologies
Provides physical, video, and access control security products and solutions worldwide.
Flawless balance sheet and good value.
Similar Companies
Market Insights

Advertisement
Community Narratives
Pinterest will surge as advertising innovations ignite revenue growth
Fair Value US$42.63|27.1% undervalued
BR
Community Contributor
Brambles' Revenue Set to Climb 14% with Profit Margins Following
Fair Value AU$21.90|5.9% overvalued
RO
Community Contributor
Challenging Future for STG as Organic Sales Decline by 8.8%
Fair Value DKK 116.13|26.8% undervalued
KA
Community Contributor